1. INTRODUCTION
The overall system architecture for the Copernicus Space Component (CSC) and its evolution are being defined on the basis of user requirements coordinated by the European Commission. The Long Term Scenario (LTS) describes the main elements of this architecture and is being generated in an iterative process in close interaction with the European Commission (COM), EUMETSAT and the EU Member States and Copernicus Participating States.
ESA needs to guarantee the continuity of the on-going operations with the maximum level of performances for the flying Copernicus Sentinels, while facing the technical and financial challenges to adapt to the foreseen future CSC architecture.
The EOF encompasses all the activities necessary to successfully deliver the expected level of CSC GS operations entrusted to ESA (i.e. establishment and maintenance of the new baseline, procurement actions, operations management, reporting, etc.).
The EOF is documented throughout a complete package describing and specifying the applicable operational concepts as well as the architecture and operations procurement approach adopted for establishing and evolving the CSC operations baseline (in particular with respects to the future Expansion Missions, associated with the necessary cost information to size the proposed approach and potential trade-offs).
The EOF implementation is based on a service architecture with well-identified components that exchange data through Internet respecting defined interfaces. A service presents a simple interface to its consumer that abstracts away the underlying complexity. Combined with deployments on public cloud infrastructure, the service approach offers large adaptability to evolution of the operational scenarios in particular for what regards scalability.
Since the transformation process which started in 2019, the EOF-CSC operations have been transferred to cloud based environments (in anticipation of the enlargement of the Copernicus Sentinel missions and in response to the ever-increasing demand for Copernicus data) and the service-oriented approach for each component of the EOF-CSC operations has been strengthened to enhance industrial competitiveness, prevent industrial and technical lock-in and introduce the necessary operational flexibility and transparency to allow the adaptation of the EOF-CSC to future challenges.
Within this context, this document outlines the system budget of the large flow of data being acquired, processed, and distributed within the EOF.
1.1. Scope
This document is part of the ESA EO Observations Framework (EOF) Copernicus Space Component (CSC) documentation package. The system budget scope is to provide an estimate of the expected operations load and the sizing of the general operations. The budget provides an end-to-end global view on the operational data flows within the period 2024 – Q1 2034. These estimations are made on the basis of current operation volumes. The budget should support the sizing of the critical elements.
1.1. EOF CSC High-Level Architecture
The functions composing the EOF-CSC architecture are implemented in the form of operational services, complying to a set of applicable input and output interfaces and to the corresponding operational performance requirements.
For the purpose of architecture and design definition, the interfaces between functions are classified as:
Data flow interfaces, for interfaces carrying Sentinel data or auxiliary information required for processing activities
Monitoring and control interfaces, for interfaces carrying reporting information (necessary for the performance monitoring at element level or end to end) or operations control information
Scheduling interfaces, for interfaces related to mission planning, including ground stations planning, satellite scheduling, etc.
Data flow interfaces, for systematic data transfer between services, are based on the concept of small data cache areas, referred to as data “interface delivery points” (IP) hereafter. Each function or service, generating a systematic or routine data flow to be further managed by one or more services, is making the output data available in an interface delivery point located on a cloud-based environment, which is logically considered as part of, and under the responsibility of, the data source service.
The architecture is presented in [RD-EOF-ARC], and Figure 1 introduces the main elements relevant for the system budget.
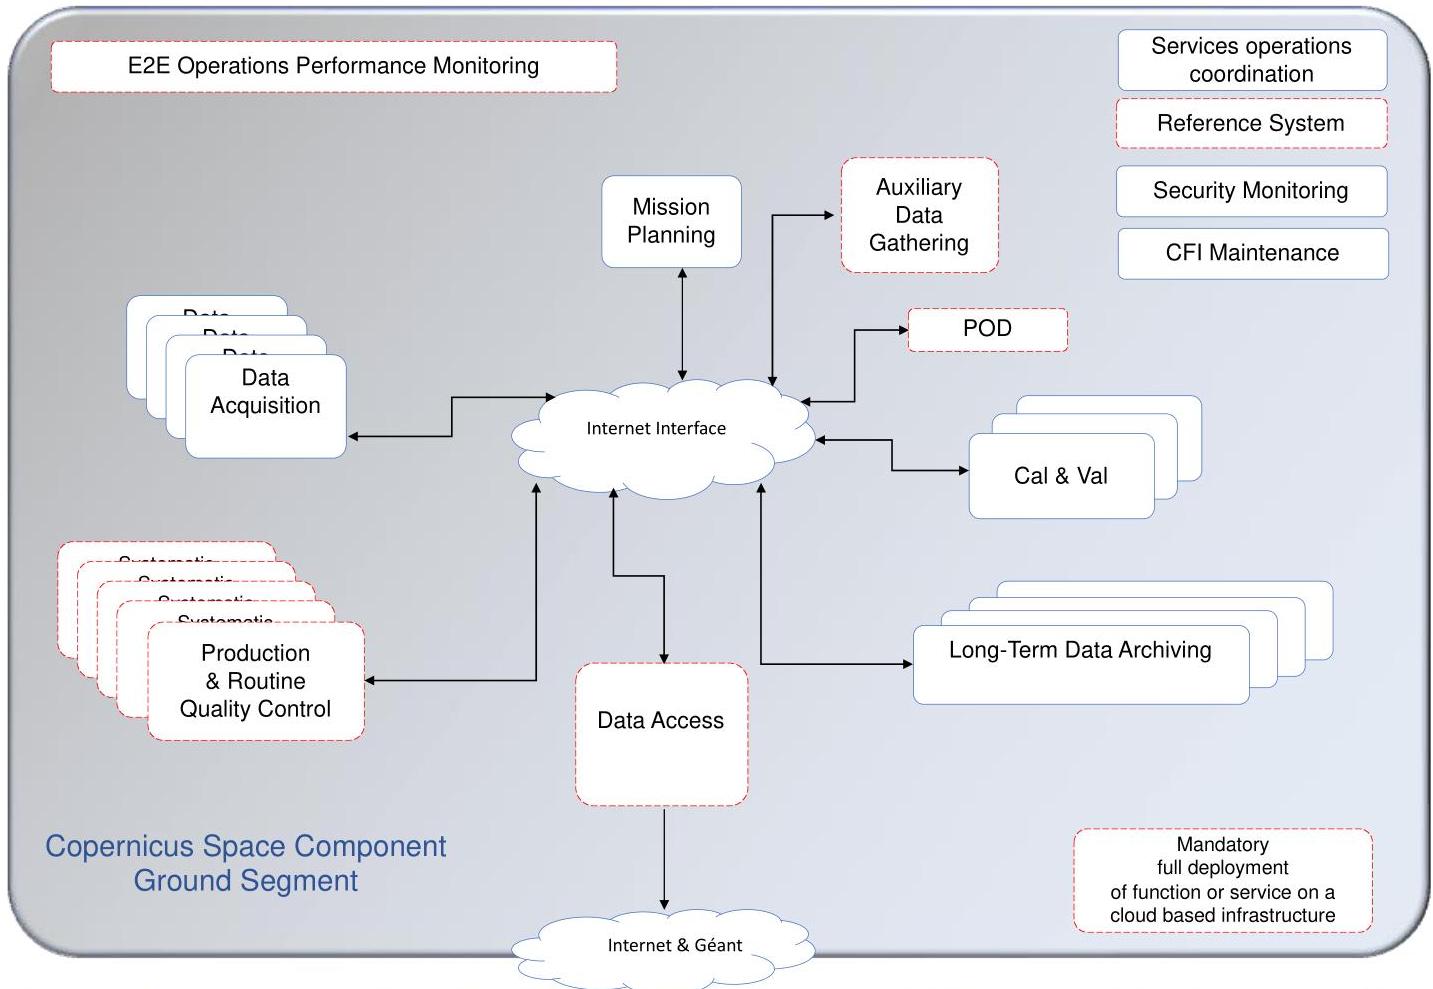
Figure 1 High level decomposition of the ESA EO Operations Framework (EOF) Copernicus Space Component (CSC) architecture
The number of instances for each service may vary, it is therefore important for the system budget to consider worst-case scenarios. The system budget does not intend to provide exact figures per mission, but rather to provide an order of magnitude sufficient for the verification of the different service sizing.
1.2. Applicable documents
The following documents are applicable to the System Technical Budget to the extent specified in this document:
| Id | Title | Reference |
|---|---|---|
| AD-EOF-DASP | Copernicus Space Component Sentinel Data Portfolio | ESA-EOPG-EOPGC-TN-12 |
1.3. Reference documents
The following documents can be consulted as they contain relevant information:
| Id | Title | Reference |
|---|---|---|
| RD-EOF-ARC | CSC Operations – ESA Framework – Ground Segment Architecture | ESA-EOPG-EOPGC-TN-12 |
| RD-EOF-LTS | The next phase of Copernicus” Updated Copernicus Space Component (CSC) Long Term Scenario | [ESA_PB-EO_2024_10_EN] LTS 2024 |
| RD-EOF-MICD | CSC Operations – ESA Framework – Master ICD | ESA-EOPG-EOPGC-IF-06 |
| RD-EOF-GLO | CSC Sentinel Ground Segment Operations Glossary | ESA-EOPG-EOPGC-TN-13 |
| RD-EOF-MSOC- | EOF CSC- Mission Specific Operations Configuration – CRISTAL Mission | ESA-EOPG-EOPGC-TN-2024-73 |
| EOF CSC- Mission Specific Operations Configuration – LSTM Mission | ESA-EOPG-EOPGC-TN-2024-83 | |
| EOF CSC- Mission Specific Operations Configuration – ROSE-L Mission | ESA-EOPG-EOPGC-TN-2024-74 | |
| EOF CSC- Mission Specific Operations Configuration – CHIME Mission | ESA-EOPG-EOPGC-TN-2024-70 | |
| EOF CSC- Mission Specific Operations Configuration – CIMR Mission | ESA-EOPG-EOPGC-TN-2024-71 |
1.2. Acronimous
1.3. Definitions
Archive Exploitation Ratio
The Users’ interest in Sentinel products can most accurately be monitored by looking at the ‘Archive Exploitation Ratio’ (AER). The AER is defined as the total number of users’ downloads (made from the hub), divided by the total number of products, (which had been published on the hubs since the start of operations). For example a ratio of 1:X indicates that, for each of the published products, there was an average number of X downloads.
Data take
The data take corresponds to the continuous sensing of a given area. The data take is downlinked from the satellite to the ground station according to the mission downlink capabilities. Data take can be downlinked in several portions in different locations.
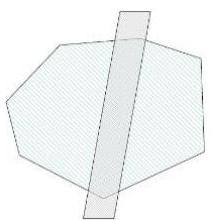
Sentinel-1 Segments and Assembled Segments
Sentinel-1 Segments of the same data take partially downlinked in different stations are assembled before processing.
Sentinel-1 Slices
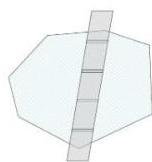
Sentinel-1 Slicing is a process applied throughout the processing Production. It consists in cutting a complete L0 segment into parts (“slices”) of configurable size, allowing to distribute and parallelize the processing over several processing nodes
Sentinel 2 Datastrip
Within a given data take, a portion of image downlinked during a pass to a given station is referred to as a “datastrip”. It is expected that the maximum length of a datastrip downlinked to a ground station is approximately 5,000 km.
Sentinel 2 Granules/Tiles
A granule is the minimum indivisible partition of a product (containing all possible spectral bands).
☐ For Level-0, Level-1A and Level-1B, granules are sub-images of a detector with a given number of lines along track. A granule covers approximately 25 km across-track and 23 km along-track.
☐ For Level-1C and Level-2A, the granules, also called tiles, are 100 km² ortho-images in UTM/WGS84 projection
Near Real Time (NRT) and Non Time Critical (NTC)
Products are categorized as either Near Real Time (NRT) or Non-Time Critical (NTC). NRT products are intended to be made available to the users less than 3 hours after acquisition of the data by the sensor. The expectation for NTC products is that they will be published within 24 hours from sensing.
TiB - a unit of information equal to 1024 gibibytes or 2^40 (1,099,511,627,776) bytes.
2. OPERATIONS SIZING
2.1. Copernicus Operations Assumptions
The operations sizing for the first generation of Sentinels are based on the measured and monitored dataflows according to their actual operations. The operations sizing for the Copernicus Expansion and Sentinel Next Generation missions are derived from the best assumptions available within the reference documentation [RD-EOF-MSOC].
In addition to the observational priorities provided by the EC, the following assumptions have been taken for the elements impacting the operations framework:
The operational lifetime of the Sentinel -1, -2 and -3 satellites and of the Copernicus Expansion satellites is assumed to be 10 years.
A maximum of 2 satellites of the same mission will be simultaneously in routine operations. Operating simultaneously more than 2 satellites of the same mission should be avoided, apart from hand-over and cross-calibration periods or if requested by the EC based on strong user needs.
2.2. Total operational time estimation
Table 1 is an overview of the overall timeline of operations of the different Copernicus missions, considering:
The above assumptions,
The projection of the operational Copernicus satellites for the period 2024-2034 according to LTS [RD-EOF-LTS]. This timeline does not include the Copernicus Expansion missions or NG Missions. For that reason in 2034 there is the impression of having 1,5 flying satellites. Howevere those are expected to be complemented by the NG missions.
The LTS considers a launch window for each mission. Here, for convenience, the beginning of the launch window is considered as the launch date.
| Satellite | 2024 | 2025 | 2026 | 2027 | 2028 | 2029 | 2030 | 2031 | 2032 | 2033 | 2034 |
|---|---|---|---|---|---|---|---|---|---|---|---|
| S1-A | |||||||||||
| S1-B | |||||||||||
| S1-C | |||||||||||
| S1-D | |||||||||||
| S2-A | |||||||||||
| S2-B | |||||||||||
| S2-C | |||||||||||
| S2-D | |||||||||||
| S3-A | |||||||||||
| S3-B | |||||||||||
| S3-C | |||||||||||
| S3-D | |||||||||||
| SSP |
Table 1: Timeline of Copernicus satellites
Grey color: commissioning phase Blue color: routine operations phase
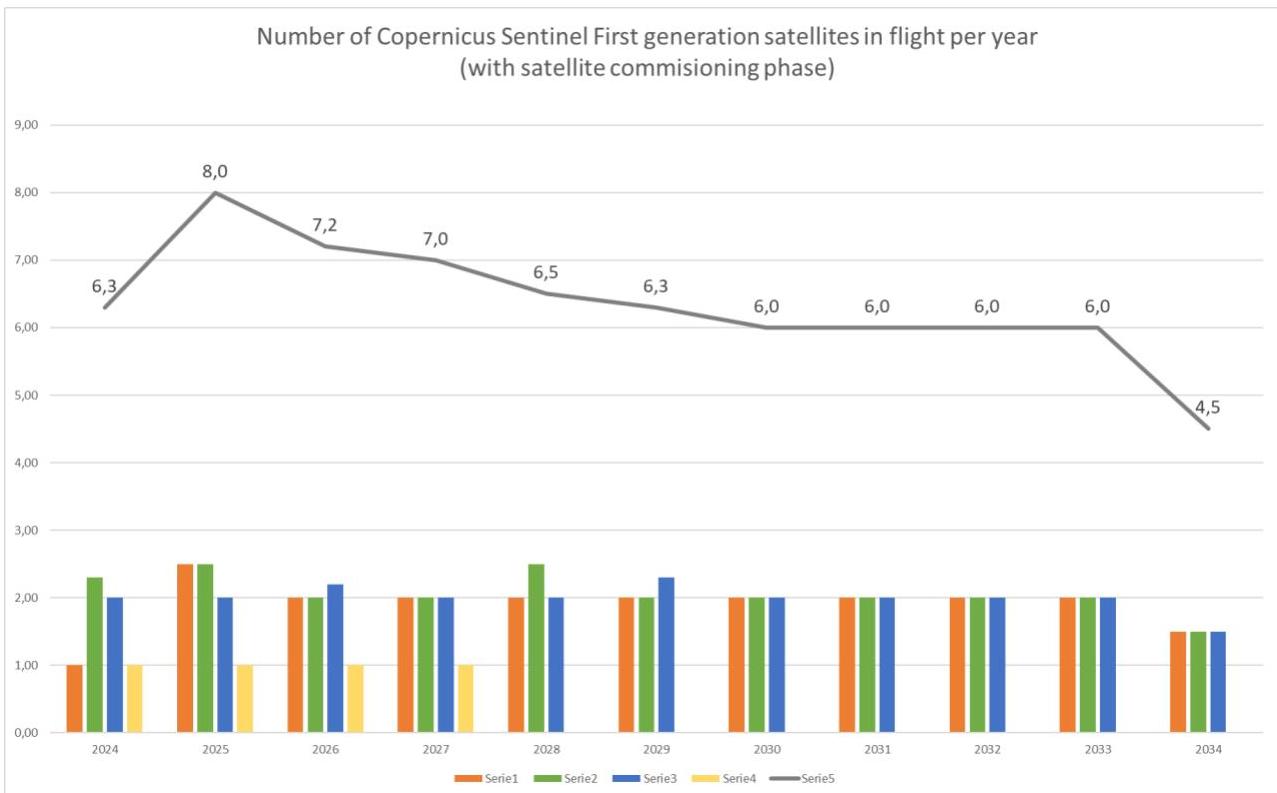
Figure 2 Yearly number of Copernicus satellites
2.3. EOF-CSC architecture elements
For the data budget, the following major EOF-CSC elements are considered:
Data Acquisition
Critical elements: Stations required bandwidth
Systematic Production, On-demand Production and Reprocessing
Critical elements: Overall bandwidth to LTA and to the Data Access
Data Access – data distribution and user scenario characterization
Critical elements: Overall bandwidth towards end users
Data Preservation (LTA)
Critical elements: Overall archiving volume evolution
2.4. Global Guidelines
Generally, the data total volume has been calculated in accordance with the following guidelines:
the average of the two satellites in routine operations (e.g. A and B) is considered for the calculations
the data volume provided from current satellites (Example S1A) is similar for future satellites for the same mission (Example S1C).
3. ACQUISITION
3.1. Definition
The overall data is estimated by considering the current volume of downlinked data. The data load has been calculated in accordance with the following assumptions:
The downlink data rate for Sentinels 1, 2, 3 is 560 Mbps and 310 Mbps for Sentinels 5P,
Sentinel 1, 2, 3 have 2 downlinks channels per satellite and 1 downlink channel for Sentinel 5P,
There is an average of 14,58 orbits per day for Sentinel-1, of 14,3 orbits per day for Sentinel- 2 and Sentinel-3 satellites and of 14,2 orbits per day for Sentinel-5P satellite,
For each mission, the satellites are spaced equidistant along the orbit (this assumption is applicable for two, three or four satellites of the same mission flying),
For Sentinel-1 and Sentinel-2, data is downlinked over all stations available in order to optimize the data delivery timeliness,
For Sentinel-1, pass-through RT happens only over X-Band Stations,
For Sentinel-3 and Sentinel-5P, data is ddownlinked only once per orbit.
3.2. Data volume
Based on the above and the average downlink times currently measured for each flying satellite, the following yearly average downlinked data is expected:
| One Satellite | Downlink Rate (Mbps) | X-Band Downlink time (nb minutes / orbit) | GdG Downlink time (nb minutes / orbit) | Total GiB orbit | Orbits daily | TiB per day | Total TiB yearly |
|---|---|---|---|---|---|---|---|
| S1 | 560 | 11,87 | 11,56 | 91,65 | 14,58 | 1,30 | 476 |
| S2 | 560 | 9,45 | 12,45 | 85,64 | 14,30 | 1,20 | 437 |
| S3 | 560 | 7,67 | - | 29,99 | 14,30 | 0,42 | 153 |
| S5P | 310 | 9,45 | - | 20,46 | 14,20 | 0,28 | 104 |
Table 2 Yearly average downlinked data volume for one Satellite
According to the current assumption on launch dates and lifetime, the following profile is expected for the yearly data volume (TiB) for each mission.
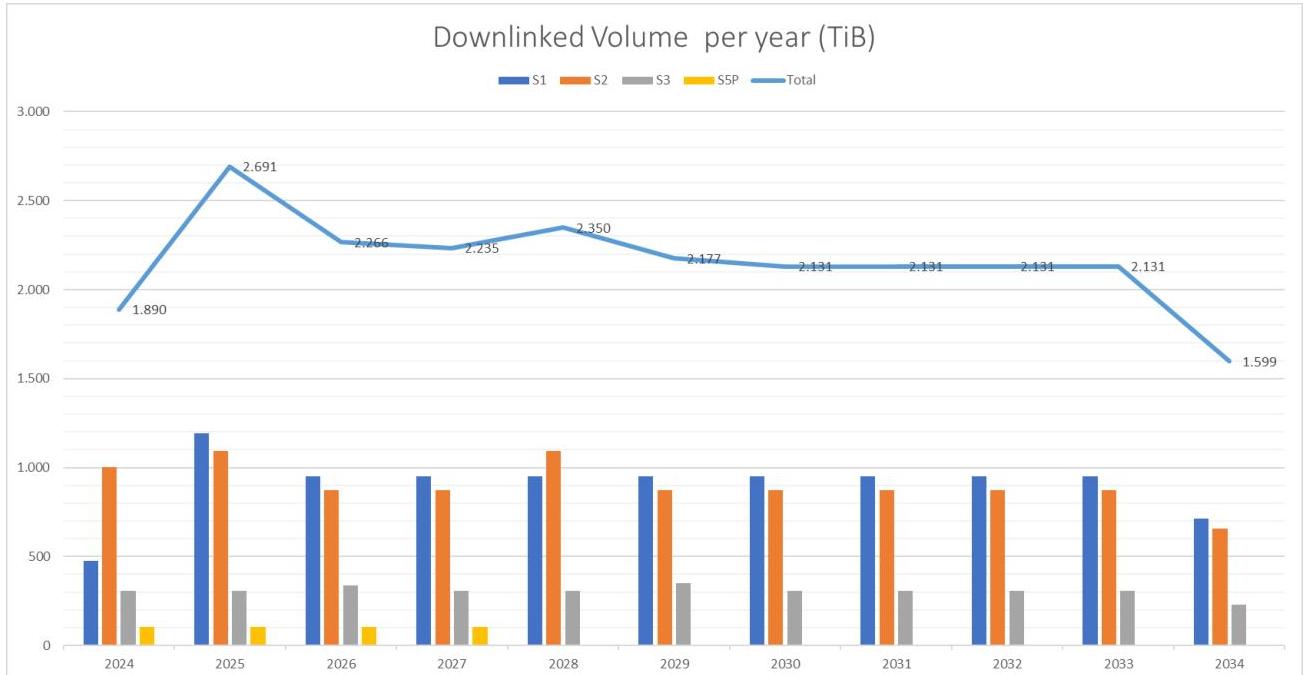
Figure 3 Downlinked volume per year (TiB)
The acquisition scenario and associated budget have to consider the variability of the scenario. The Acquisition service shall adapt the capacity to the required load, taking in consideration potential shifts.
3.3. Bandwidth
The above volume is to be circulated between the station physical location and the interface delivery point.
In average the required transfer rate is below 1 Gb/s and should not create a technological risk. Still, the downlink patterns may create peaks of activities that need to be sized.
A scenario in which 4 satellites would downlink for 10 minutes in parallel, with 15 minutes to get the data out of the station would lead to a bandwidth of about 2 Gb/s.
The Acquisition Service shall pay attention to such situations that may become critical through time.
Even if this scenario is unlikely, exceptional circumstances like contingencies and the need to disseminate several orbits in parallel may create similar situations. The Acquisition services shall take in consideration some margins to accommodate this need.
4. OVERALL DATA FLOWS
The system budget is mainly driven by the systematic production. The following sections present the overall production frame, the Long-Term Archiving and the data dissemination.
4.1. Data flow scenarios
The following table represents the circulation between the architectural elements of the CGS EOF-CSC
| Mission | Timeliness | L0 | L1 | L2 |
|---|---|---|---|---|
| S1 | NRT | DD, LTA | DD | DD |
| NTC | DD, LTA | DD | DD | |
| S2 | NTC | LTA | DD | DD |
| S3 | NRT + STC | LTA | DD | DD |
| NTC | XX | DD | DD | |
| S5P | NRT | X | DD | DD |
| NTC (OFFL) | LTA | DD | DD |
Table 3 Synthesis data flow
X This type does not exist
XX Not circulated Product types
5. DATA PRODUCTION
All the volumes and number mission specificities are reported in chapter 8 DATA FLOW PROCESS CHART, taking into account the mission rules available in chapter 10 ANNEX.
The production allows to generate:
Level-0 from CADUs chunks
Level-1 and Level-2 products from Level-0.
5.1. Data Volume
The following tables provides the estimated Sentinel-1, Sentinel-3 and Sentinel-5P average volumes per mission product level for one satellite:
| Volume | |||||||
| Per Day | |||||||
| (TiB per One satellite per day) | L0 | L1 | L2 | Total | |||
| NRT | NTC | NRT | NTC | NRT | NTC | all Levels and timeliness types | |
| S1 | 0,242 | 0,685 | 0,700 | 2,016 | 0,001 | 0,004 | 3,649 |
| S3 | 0,289 | 0,000 | 0,528 | 0,466 | 0,108 | 0,148 | 1,539 |
| S5P | X | 0,245 | 0,622 | 0,573 | 0,061 | 0,069 | 1,570 |
| Per Week | |||||||
| (TiB per One satellite per week) | L0 | L1 | L2 | Total | |||
| NRT | NTC | NRT | NTC | NRT | NTC | all Levels and timeliness types | |
| S1 | 1,696 | 4,797 | 4,903 | 14,113 | 0,009 | 0,025 | 25,543 |
| S3 | 2,026 | 0,000 | 3,698 | 3,260 | 0,754 | 1,038 | 10,776 |
| S5P | X | 1,712 | 4,355 | 4,010 | 0,425 | 0,486 | 10,987 |
| Per Month | |||||||
| (TiB per One satellite per month) | L0 | L1 | L2 | Total | |||
| NRT | NTC | NRT | NTC | NRT | NTC | all Levels and timeliness types | |
| S1 | 7,377 | 20,859 | 21,319 | 61,365 | 0,000 | 0,109 | 111,029 |
| S3 | 8,805 | 0,000 | 16,069 | 14,165 | 3,277 | 4,508 | 46,824 |
| S5P | X | 7,437 | 18,922 | 17,424 | 1,845 | 2,113 | 47,740 |
| Per Year | |||||||
| (TiB per One satellite year) | L0 | L1 | L2 | Total | |||
| NRT | NTC | NRT | NTC | NRT | NTC | all Levels and timeliness types | |
| S1 | 88,520 | 250,306 | 255,831 | 736,385 | 0,461 | 1,309 | 1332,813 |
| S3 | 105,657 | 0,000 | 192,832 | 169,980 | 39,322 | 54,102 | 561,893 |
| S5P | X | 89,245 | 227,058 | 209,089 | 22,136 | 25,357 | 572,885 |
Table 4 Sentinel-1, Sentinel-3 and Sentinel-5P Production Volumes (TiB) per product level for one satellite
The following table provides the estimated Sentinel-1 average volumes per product type for one satellite:
| Volume | ||||||||
|---|---|---|---|---|---|---|---|---|
| Per Day | ||||||||
| S1 (TiB per One satellite per day) | L0 | GRD | SLC | OCN | ||||
| NRT | NTC | NRT | NTC | NRT | NTC | NRT | NTC | |
| 0,242 | 0,685 | 0,126 | 0,353 | 0,604 | 1,763 | 0,001 | 0,003 | |
| Total | 0,928 | 0,479 | 2,368 | 0,004 | ||||
| Per Week | ||||||||
| S1 (TiB per One satellite week) | L0 | GRD | SLC | OCN | ||||
| NRT | NTC | NRT | NTC | NRT | NTC | NRT | NTC | |
| 1,70 | 4,797 | 0,882 | 2,471 | 4,230 | 12,342 | 0,007 | 0,021 | |
| Total | 6,494 | 3,353 | 16,573 | 0,028 | ||||
| Per Month | ||||||||
| S1 (TiB per One satellite month) | L0 | GRD | SLC | OCN | ||||
| NRT | NTC | NRT | NTC | NRT | NTC | NRT | NTC | |
| 7,377 | 20,859 | 3,835 | 10,744 | 18,395 | 53,667 | 0,030 | 0,091 | |
| Total | 28,236 | 14,580 | 72,061 | 0,122 | ||||
| Per Year | ||||||||
| S1 (TiB per One satellite year) | L0 | GRD | SLC | OCN | ||||
| NRT | NTC | NRT | NTC | NRT | NTC | NRT | NTC | |
| 88,520 | 250,306 | 46,022 | 128,933 | 220,734 | 644,000 | 0,365 | 1,096 | |
| Total | 338,826 | 174,955 | 864,734 | 1,461 | ||||
Table 5 Sentinel-1 Production Volumes (TiB) per product type for one satellite
The following table provides the estimated Sentinel-3 average volumes per instrument and level for one satellite:
| Per Day | ||||||||
| S3 [TIB per One satellite per day] | OLCI | SLSTR | SYNERGY | SRAL | ||||
| NRT | NTC | NRT | NTC | NRT | NTC | NRT | NTC | |
| L0 | 0,107 | 0,000 | 0,055 | 0,000 | 0,000 | 0,000 | 0,127 | 0,000 |
| L1 | 0,178 | 0,178 | 0,172 | 0,171 | 0,050 | 0,050 | 0,128 | 0,066 |
| L2 | 0,022 | 0,022 | 0,026 | 0,055 | 0,0548 | 0,0689 | 0,00544 | 0,00243 |
| Total | 0,307 | 0,200 | 0,253 | 0,227 | 0,105 | 0,119 | 0,261 | 0,068 |
| Total | 0,507 | 0,479 | 0,224 | 0,329 | ||||
| Per Week | ||||||||
| S3 [TIB per One satellite per week] | OLCI | SLSTR | SYNERGY | SRAL | ||||
| NRT | NTC | NRT | NTC | NRT | NTC | NRT | NTC | |
| L0 | 0,750 | 0,000 | 0,384 | 0,000 | 0,000 | 0,000 | 0,891 | 0,000 |
| L1 | 1,247 | 1,249 | 1,202 | 1,200 | 0,350 | 0,350 | 0,898 | 0,460 |
| L2 | 0,151 | 0,151 | 0,182 | 0,387 | 0,384 | 0,482 | 6,286 | 3,220 |
| Total | 2,147 | 1,401 | 1,768 | 1,587 | 0,734 | 0,833 | 8,075 | 3,680 |
| Total | 3,548 | 3,355 | 1,566 | 11,756 | ||||
| Per Month | ||||||||
| S3 [TIB per One satellite per month] | OLCI | SLSTR | SYNERGY | SRAL | ||||
| NRT | NTC | NRT | NTC | NRT | NTC | NRT | NTC | |
| L0 | 3,259 | 0,000 | 1,669 | 0,000 | 0,000 | 0,000 | 3,876 | 0,000 |
| L1 | 5,421 | 5,433 | 5,229 | 5,217 | 1,523 | 1,523 | 3,905 | 2,000 |
| L2 | 0,655 | 0,659 | 0,791 | 1,682 | 1,668 | 2,097 | 0,166 | 0,074 |
| Total | 9,336 | 6,091 | 7,689 | 6,899 | 3,191 | 3,620 | 7,946 | 2,074 |
| Total | 15,427 | 14,588 | 6,811 | 10,020 | ||||
| Per Year | ||||||||
| S3 [TIB per One satellite per year] | OLCI | SLSTR | SYNERGY | SRAL | ||||
| NRT | NTC | NRT | NTC | NRT | NTC | NRT | NTC | |
| L0 | 39,112 | 0,000 | 20,030 | 0,000 | 0,000 | 0,000 | 46,510 | 0,000 |
| L1 | 65,055 | 65,192 | 62,743 | 62,606 | 18,278 | 18,278 | 46,856 | 24,004 |
| L2 | 7,862 | 7,905 | 9,489 | 20,183 | 20,011 | 25,166 | 1,986 | 0,886 |
| Total | 112,030 | 73,097 | 92,262 | 82,789 | 38,290 | 43,444 | 95,353 | 24,890 |
| Total | 185,127 | 175,051 | 81,733 | 120,243 | ||||
Table 6 Sentinel-3 Production Volumes (TiB) per instrument and level for one satellite
The following table provides the estimated Sentinel-2 average volumes per product type and for one satellite. There aren’t different production timeliness for Sentinel-2.
| Per Day | ||||||
|---|---|---|---|---|---|---|
| 0,980 | 0,000 | 1,104 | 2,562 | 3,661 | 8,308 | |
Per Week
| S2 (TiB per One satellite week) | L0 | L1A | L1B | L1C | L2A | Total |
|---|---|---|---|---|---|---|
| 6,862 | 0,003 | 7,731 | 17,935 | 25,627 | 58,158 |
Per Month
| S2 (TiB per One satellite month) | L0 | L1A | L1B | L1C | L2A | Total |
|---|---|---|---|---|---|---|
| 29,817 | 0,011 | 33,595 | 77,932 | 111,356 | 252,711 |
Per Year
| S2 (TiB per One satellite year) | L0 | L1A | L1B | L1C | L2A | Total |
|---|---|---|---|---|---|---|
| 357,809 | 0,132 | 403,139 | 935,186 | 1336,268 | 3032,533 |
Table 7 Sentinel 2 Production Volumes (TiB) per product type for one satellite
According to the current assumption on launch dates and lifetime (RD-EOF-LTS), the following profile is expected for the overall yearly NTC data volume (PiB). As Sentinel-2 does not have NRT production, relevant data volume is included only in NTC graph:
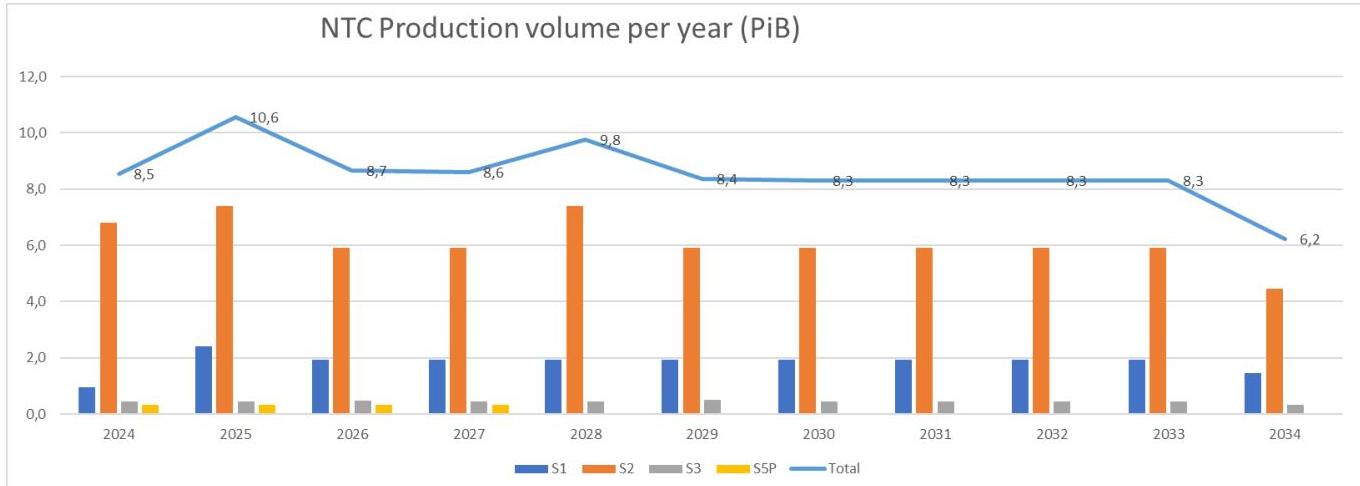
Figure 4 NTC Yearly Production Data Volume (PiB)
Sentinel-1, Sentinel-3 and Sentinel-5P NRT Production is presented here below:
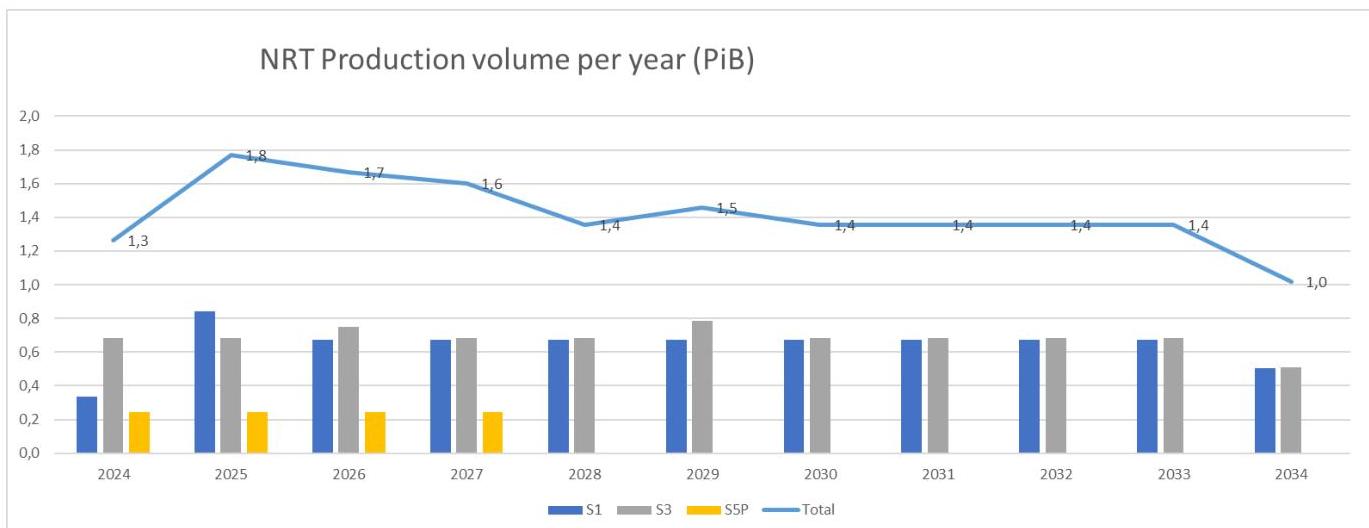
Figure 5 Sentinel-1, Sentinel-35 and Sentinel-S5P NRT Yearly Production Data Volume (PiB)
The total average bandwidth for circulating the production is equivalent to 4 Gb/s, which is within a range of common on-the-shelf service for cloud providers. The variability through time already mentioned for the acquisition is to be considered as well (i.e. network scalability on the cloud provider side would deserve some attention as the service offer may differ from one provider to another).
5.2. Number of Products
The following tables provide the estimated Sentinel-1, Sentinel-3 and Sentinel-5P average number of products per mission-product level for one satellite:
| Number of Products in production | |||||||
| Daily: | |||||||
| Num Products per One satellite per day | L0 | L1 | L2 | Total | |||
| NRT | NTC | NRT | NTC | NRT | NTC | all Levels and timeliness types | |
| S1 | 283 | 781 | 654 | 1764 | 246 | 470 | 4196.55 |
| S3 | 986 | 0 | 1.143 | 786 | 1.286 | 1.515 | 5.716 |
| S5P | X | 756 | 1.720 | 162 | 1.791 | 204 | 4.633 |
| Weekly: | |||||||
| Products per One satellite per week | L0 | L1 | L2 | Total | |||
| NRT | NTC | NRT | NTC | NRT | NTC | all Levels and timeliness types | |
| S1 | 1.980 | 5.466 | 4.576 | 12.347 | 1.719 | 3.289 | 29.376 |
| S3 | 6.903 | 0 | 8.003 | 5.502 | 9.003 | 10.603 | 40.014 |
| S5P | X | 5292 | 12.040 | 1.131 | 12.537 | 1.428 | 32.428 |
| Monthly: | |||||||
| Products per One satellite per month | L0 | L1 | L2 | Total | |||
| NRT | NTC | NRT | NTC | NRT | NTC | all Levels and timeliness types | |
| S1 | 8.609 | 23.767 | 19.896 | 53.688 | 7.473 | 14.300 | 127.732 |
| S3 | 29.994 | 0 | 34.775 | 23.907 | 39.120 | 46.075 | 173.870 |
| S5P | X | 22.995 | 52.317 | 4.912 | 54.476 | 6.205 | 140.905 |
| Yearly: | |||||||
| Products per One satellite per year | L0 | L1 | L2 | Total | |||
| NRT | NTC | NRT | NTC | NRT | NTC | all Levels and timeliness types | |
| S1 | 103.305 | 285.210 | 238.752 | 644.250 | 89.673 | 171.599 | 1.532.789 |
| S3 | 359.927 | 0 | 417.297 | 286.883 | 469.437 | 552.895 | 2.086.439 |
| S5P | X | 275.940 | 627.800 | 58.948 | 653.715 | 74.460 | 1.690.863 |
Table 8 Sentinel-1, Sentinel-3 and Sentinel-5P produced number of products per product level for one satellite
| Number of products | ||||||
| Daily: | ||||||
| S2 Num Products per One satellite per day. (After Transformation) | L0L1AL1B | L1C | L2A | Total | ||
| 58.5522656.382 | 11.922 | 11.778 | 138.660 | |||
Weekly:
| S2 Products per satellite per One week (After Transformation) | L0 | L1A | L1B | L1C | L2A | Total |
| 409.863 | 183 | 394.671 | 83.456 | 82.447 | 970.619 |
Monthly:
| S2 Products per One satellite per month (After Transformation) | L0 | L1A | L1B | L1C | L2A | Total |
| 1.780.952 | 793 | 1.714.941 | 362.636 | 358.251 | 4.217.572 |
Yearly:
| S2 Products per One satellite per year (After Transformation) | L0 | L1A | L1B | L1C | L2A | Total |
| 21.371.425 | 9.520 | 20.579.287 | 4.351.630 | 4.299.006 | 50.610.868 |
Table 9 Sentinel-2 produced number of products for one satellite
For the number of products of Sentinel-2 see explanation in Chapter 9.3.
According to the current assumption on launch dates and lifetime (RD-EOF-LTS), the following profiles are expected for the yearly number of products(PiB) produced for each mission. As Sentinel-2 does not have NRT production, number of data volume are presented only as NTC.
S1, S3 and S5P NTC number of products per year
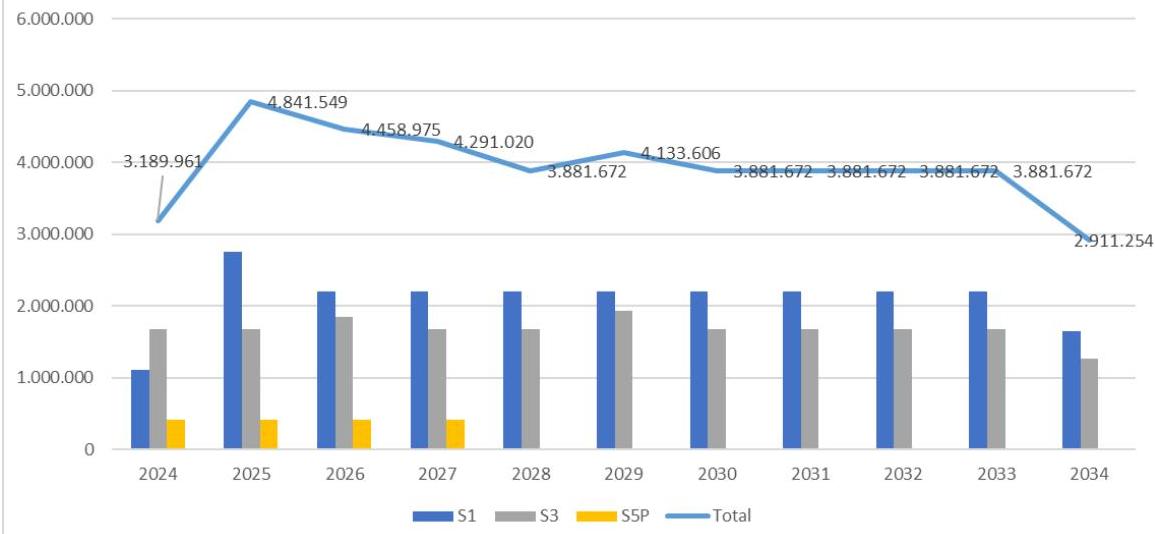
Figure 6 Yearly S1, S3, S5P NTC Number of products
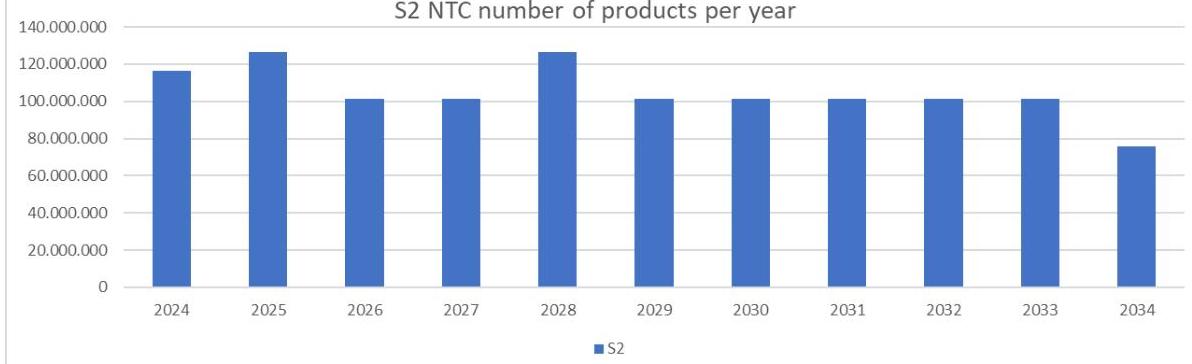
Figure 7 Yearly S2 NTC Number of products
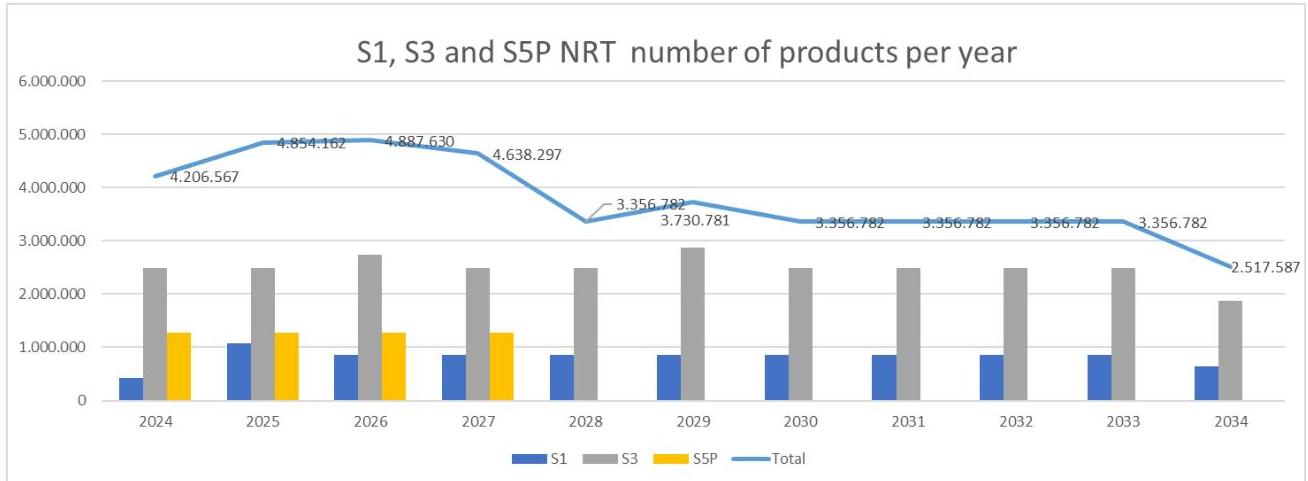
Figure 8 Yearly S1, S3, S5P NRT Number of products
6. DATA PRESERVATION
6.1. Definition
The long-term archiving function pursues two main objectives:
Preserve the L0 and auxiliary mission data for the long term,
Offer efficient access to past data for the operations services (e.g. data distribution, reprocessing, on-demand production, …)
6.2. Guidelines
The budget is provided considering a unique equivalent LTA regrouping all missions,
L0 products of all missions are archived. The list of L0 for each mission is given in the tables in chapter 10 ANNEX.
Auxiliary data of all missions are archived. For S5P auxiliary data has started to be archived in one of the LTA since March 2024, including the historical ones. The list of auxiliary for each mission is given in the tables in chapter 10 ANNEX.
6.3. Auxiliary Data Volume
Auxiliary data are generated from by external data providers or from production services (such as Sentinel-1 ETAD atmospheric auxiliary data) and used in the processing.
The following tables provide the Auxiliary average data volumes per mission to be archived in the LTAs, according to the current operational scenario.
Since March 2024 Sentinel-5P auxiliary data, both historical and new generated, are also archived by one of the four LTAs.
Only systematic auxiliary data are considered in this estimation, as volume of asynchronous auxiliary data (e.g. configuration files) can be considered negligible.
| Auxiliary Volume | |
| Per Day | |
| (TiB per per day) | AUX |
| S1 | 0,057 |
| S2 | 0,007 |
| S3 | 0,015 |
| S5P | 0,157 |
| Per Week | |
| (TiB per per week) | AUX |
| S1 | 0,397 |
| S2 | 0,051 |
| S3 | 0,106 |
| S5P | 1,102 |
| Per Month | |
| (TiB per month) | AUX |
| S1 | 1,728 |
| S2 | 0,221 |
| S3 | 0,461 |
| S5P | 4,790 |
| Per Year | |
| (TiB per year) | AUX |
| S1 | 20,735 |
| S2 | 2,655 |
| S3 | 5,532 |
| S5P | 57,478 |
Table 10 Auxiliary Data Volumes (TiB) for each mission
6.4. Level 0 Data Volume
The LTA average volume of new acquired L0 data per year for one satellite is estimated for each mission, according to the current operational scenario, and given in the following table:
| One Satellite | TiB per day | TiB per Month | TiB per Year |
| S1 | 0,93 | 28,24 | 338,83 |
| S2 | 0,98 | 29,84 | 358,05 |
| S3 | 0,32 | 9,78 | 117,30 |
| S5P | 0,24 | 7,44 | 89,31 |
| Total | 2,47 | 75 | 903,49 |
Table 11 Yearly LTA volume of newly acquired L0 data (TiB)
6.5. Cumulative Auxiliary and Level 0 Data Volume
The cumulative Auxiliary and Level 0 volume is reported in the table below. It is based on the last “Long Term Scenario” (RD-EOF-LTS).
| Volume [PiB] | ||||||||||
| S1 L0 | S1 AUX | S2 L0 | S2 AUX | S3 L0 | S3 AUX | S5P L0 | S5P AUX | All L0 | All AUX | |
| Historical data@Dec2024 | 4,48 | 0,033 | 5,36 | 0,019 | 1,66 | 0,044 | 0,59 | 0,044 | 12,08 | 0,14 |
| 2025 | 5,30 | 0,084 | 6,23 | 0,026 | 1,87 | 0,054 | 0,68 | 0,054 | 14,08 | 0,22 |
| 2026 | 5,97 | 0,124 | 6,93 | 0,031 | 2,09 | 0,066 | 0,76 | 0,066 | 15,75 | 0,29 |
| 2027 | 6,63 | 0,165 | 7,63 | 0,036 | 2,30 | 0,077 | 0,85 | 0,077 | 17,41 | 0,35 |
| 2028 | 7,29 | 0,205 | 8,50 | 0,043 | 2,51 | 0,088 | 0,85 | 0,088 | 19,15 | 0,42 |
| 2029 | 7,95 | 0,246 | 9,20 | 0,048 | 2,75 | 0,100 | 0,85 | 0,100 | 20,75 | 0,49 |
| 2030 | 8,61 | 0,286 | 9,90 | 0,053 | 2,95 | 0,111 | 0,85 | 0,111 | 22,32 | 0,56 |
| 2031 | 9,27 | 0,327 | 10,60 | 0,058 | 3,16 | 0,122 | 0,85 | 0,122 | 23,88 | 0,63 |
| 2032 | 9,94 | 0,367 | 11,30 | 0,063 | 3,36 | 0,133 | 0,85 | 0,133 | 25,45 | 0,70 |
| 2033 | 10,60 | 0,408 | 12,00 | 0,069 | 3,57 | 0,143 | 0,85 | 0,143 | 27,02 | 0,76 |
| 2034 | 11,09 | 0,438 | 12,52 | 0,072 | 3,73 | 0,152 | 0,85 | 0,152 | 28,19 | 0,81 |
Table 12 Yearly AUX and L0 Cumulative Volume (PiB) one copy per mission
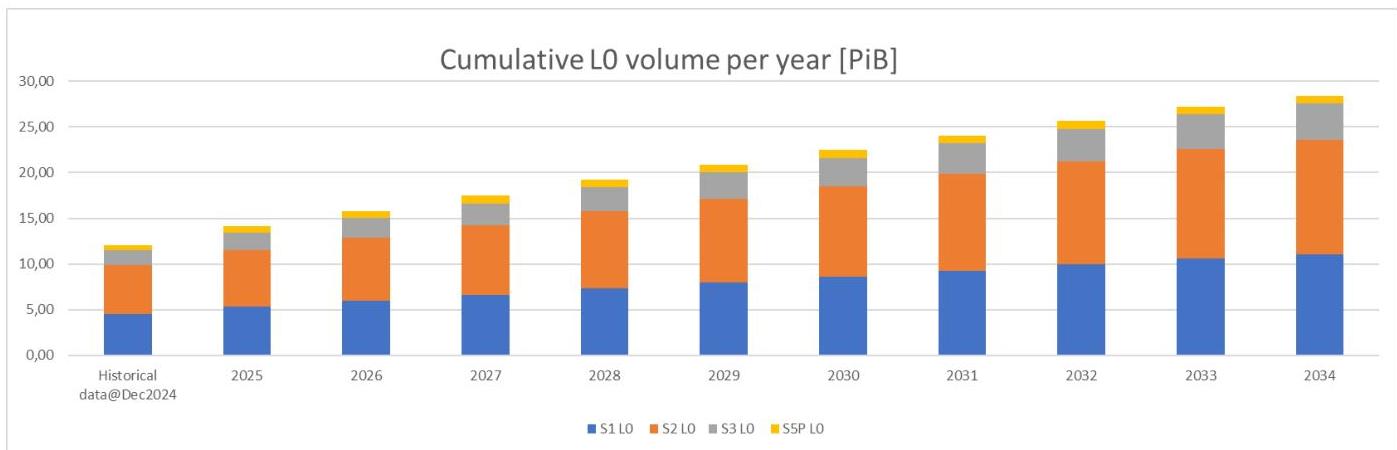
Figure 9 Yearly L0 Cumulative volume (PiB) one copy per mission
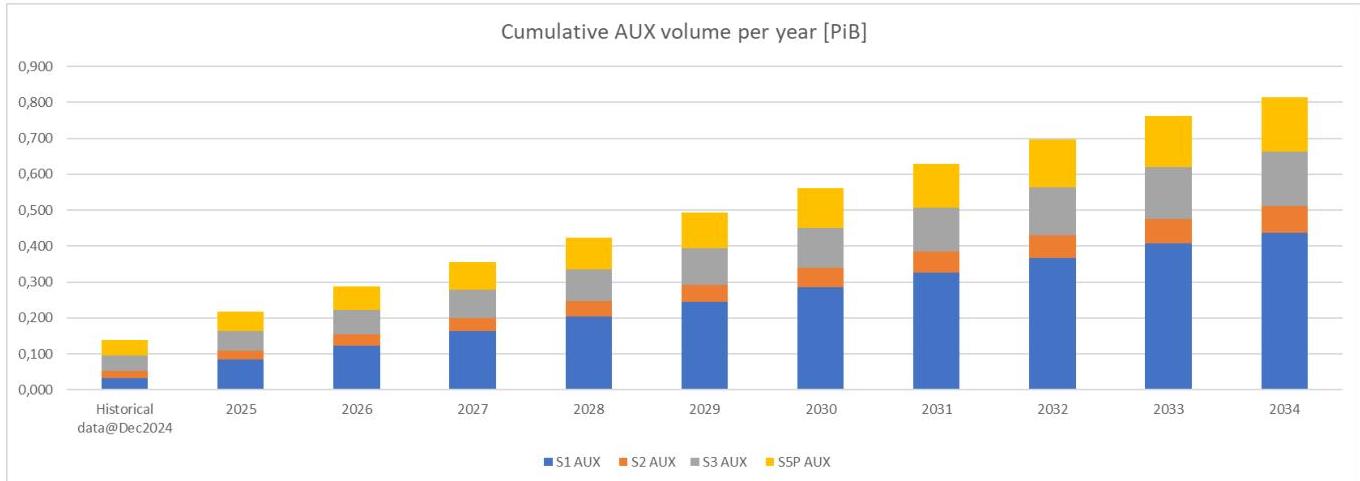
Figure 10 YearlyAUX Cumulative volume (PiB) one copy per mission
6.6. Auxiliary Number of products
The following tables provide the average numbers of Auxiliary data per mission to be archived in the LTAs, according to the current operational scenario.
To be consistent with the volume estimation, only systematic auxiliary data are taken into account:
| Auxiliary Number of products | |
| Per Day | |
| (Num per day) | AUX |
| S1 | 889,30 |
| S2 | 259,28 |
| S3 | 92,56 |
| S5P | 4567,84 |
| Per Week | |
| (Num per week) | AUX |
| S1 | 6225,10 |
| S2 | 1814,97 |
| S3 | 647,92 |
| S5P | 31974,89 |
| Per Month | |
| (Num per month) | AUX |
| S1 | 27068,07 |
| S2 | 7891,89 |
| S3 | 2817,30 |
| S5P | 139033,66 |
| Per Year | |
| (Num per year) | AUX |
| S1 | 324816,83 |
| S2 | 94702,66 |
| S3 | 33807,54 |
| S5P | 1668403,96 |
Table 13 Number of Auxiliary data for each mission
6.7. Level 0 Number of products
The total amount of L0 products in LTA since the launch of the missions satellites until end of December 2024 is given in the table below:
| Satellite | L0 |
| S1A+S1B | 5.372.698 |
| S2A+S2B | 327.397.730 |
| S3A+S3B | 5.177.646 |
| S5P | 2.052.217 |
| Total | 340.000.291 |
Table 14 Total Number of Products archived until December 2024 (Historical data)
The estimated average numbers of L0 products, according to the current operational scenario, archived in LTA for one satellite per year is given in the table below.
| One Satellite | Num Per Day | Num Per Month | Num Per Year |
|---|---|---|---|
| S1 | 1.064 | 32.376 | 388.515 |
| S2 | 58.523 | 1.781.289 | 21.375.471 |
| S3 | 986 | 30.014 | 360.173 |
| S5P | 756 | 23.011 | 276.129 |
| Total | 61.329 | 1.866.691 | 22.400.288 |
Table 15 Yearly Total Number of Products archived (newly acquired data)
7. DATA DISTRIBUTION
The volumes and the number of products presented in this section are representative for the Data Access system.
Data Access system has been provided by the Copernicus Open Access Hub (Open Access Hub (copernicus.eu)) until 01/11/2023 and since then from the Copernicus Data Space Ecosystem (CDSE - Copernicus Data Space Ecosystem | Europe’s eyes on Earth).
The CDSE started its ramp-up operations at the end of January 2023 and operated together with the Open Access Hub for most of 2023, gradually increasing its functionalities throughout the year. Since the Open Access Hub decommissioning, the CDSE has been the ESA’s sole data access service for Copernicus Sentinel data.
In addition to the User level data CDSE has started publishing also the engineering data for each mission, consisting in L0 products and auxiliary data. Such data has a 14-days rolling policy and are restricted to expert users.
7.1. Published Data volumes
The current average user level data volumes published at the Data Access system, for one satellite, is summarized in the table below divided per product level and mission:
Published Data Volumes
L0
| One Satellite | TiB per day | TiB per Month | TiB per Year |
|---|---|---|---|
| S1 | 0,93 | 28,24 | 338,83 |
| S2 | 0,00 | 0,00 | 0,00 |
| S3 | 0,00 | 0,00 | 0,00 |
| S5P | 0,00 | 0,00 | 0,00 |
| Total | 0,93 | 28,24 | 338,83 |
L1
| One Satellite | TiB per day | TiB per Month | TiB per Year |
|---|---|---|---|
| S1 | 4,62 | 140,56 | 1686,77 |
| S2 (L1C) | 2,40 | 73,19 | 878,26 |
| S3 | 0,89 | 27,11 | 325,32 |
| S5P | 1,19 | 36,37 | 436,45 |
| Total | 9,11 | 277,23 | 3326,80 |
L2
| One Satellite | TiB per day | TiB per Month | TiB per Year |
|---|---|---|---|
| S1 | 0,01 | 0,25 | 3,01 |
| S2 (L2A) | 3,18 | 96,63 | 1159,61 |
| S3 | 0,26 | 7,79 | 93,42 |
| S5P | 0,00 | 0,13 | 1,52 |
| Total | 3,45 | 104,80 | 1257,56 |
Total
| One Satellite | TiB per day | TiB per Month | TiB per Year |
|---|---|---|---|
| S1 | 5,55 | 169,05 | 2028,60 |
| S2 | 5,58 | 169,82 | 2037,87 |
| S3 | 1,15 | 34,90 | 418,75 |
| S5P | 1,20 | 36,50 | 437,96 |
| Total | 13,48 | 410,27 | 4923,18 |
Table 16: Yearly average published data volumes per product level and mission (TiB)
The following tables report instead, separately for Sentinel-1, Sentinel-2 and Sentinel-3, the user level data volumes published at the Data Access system, for one satellite, divided per product type:
| Published Data Volumes | ||||||||
| Per Day | ||||||||
| S1 (TiB per one satellite per day) | L0 | GRD | SLC | OCN | ||||
| NRT | NTC | NRT | NTC | NRT | NTC | NRT | NTC | |
| 0,242 | 0,685 | 0,126 | 0,353 | 0,604 | 1,763 | 0,001 | 0,003 | |
| Total | 0,928 | 0,479 | 2,368 | 0,004 | ||||
| Per Week | ||||||||
| S1 (TiB per one satellite per week) | L0 | GRD | SLC | OCN | ||||
| NRT | NTC | NRT | NTC | NRT | NTC | NRT | NTC | |
| 1,70 | 4,797 | 0,882 | 2,471 | 4,230 | 12,342 | 0,007 | 0,021 | |
| Total | 6,494 | 3,353 | 16,573 | 0,028 | ||||
| Per Month | ||||||||
| S1 (TiB per one satellite per month) | L0 | GRD | SLC | OCN | ||||
| NRT | NTC | NRT | NTC | NRT | NTC | NRT | NTC | |
| 7,377 | 20,859 | 3,835 | 10,744 | 18,395 | 53,667 | 0,030 | 0,091 | |
| Total | 28,236 | 14,580 | 72,061 | 0,122 | ||||
| Per Year | ||||||||
| S1 (TiB per one satellite per year) | L0 | GRD | SLC | OCN | ||||
| NRT | NTC | NRT | NTC | NRT | NTC | NRT | NTC | |
| 88,520 | 250,306 | 46,022 | 128,933 | 220,734 | 644,000 | 0,365 | 1,096 | |
| Total | 338,826 | 174,955 | 864,734 | 1,461 | ||||
Table 17: Sentinel-1 published data volumes per product type (TiB)
| Published Data Volumes | |||||
| Per Day | |||||
| S2 (TiB per one satellite per day) | L0 | L1A | L1B | L1C | L2A |
| 0,00 | 0,00 | 0,00 | 2,40 | 3,18 | |
| Per Week | |||||
| S2 (TiB per one satellite per week) | L0 | L1A | L1B | L1C | L2A |
| 0,00 | 0,00 | 0,00 | 16,83 | 22,24 | |
| Per Month | |||||
| S2 (TiB per one satellite per month) | L0 | L1A | L1B | L1C | L2A |
| 0,00 | 0,00 | 0,00 | 73,14 | 96,63 | |
| Per Year | |||||
| S2 (TiB per one satellite per year) | L0 | L1A | L1B | L1C | L2A |
| 0,00 | 0,00 | 0,00 | 877,66 | 1159,61 | |
Table 18: Sentinel-2 published data volumes per product type (TiB)
| Published Data Volumes | ||||||||
| Per Day | ||||||||
| S3 (TIB per one satellite per day) | OLCI | SLSTR | SYNERGY | SRAL | ||||
| NRT | NTC | NRT | NTC | NRT | NTC | NRT | NTC | |
| L0 | 0,000 | 0,000 | 0,000 | 0,000 | 0,000 | 0,000 | 0,000 | 0,000 |
| L1 | 0,178 | 0,178 | 0,172 | 0,000 | 0,000 | 0,000 | 0,126 | 0,065 |
| L2 | 0,022 | 0,022 | 0,026 | 0,000 | 0,0538 | 0,068 | 0,005 | 0,002 |
| Total | 0,200 | 0,200 | 0,198 | 0,000 | 0,054 | 0,068 | 0,132 | 0,067 |
| Total | 0,400 | 0,198 | 0,122 | 0,199 | ||||
| Per Week | ||||||||
| S3 (TIB per one satellite per week) | OLCI | SLSTR | SYNERGY | SRAL | ||||
| NRT | NTC | NRT | NTC | NRT | NTC | NRT | NTC | |
| L0 | 0,000 | 0,000 | 0,000 | 0,000 | 0,000 | 0,000 | 0,000 | 0,000 |
| L1 | 1,247 | 1,249 | 1,202 | 0,000 | 0,000 | 0,000 | 0,884 | 0,453 |
| L2 | 0,151 | 0,151 | 0,182 | 0,000 | 0,377 | 0,478 | 6,185 | 3,169 |
| Total | 1,397 | 1,401 | 1,384 | 0,000 | 0,377 | 0,478 | 7,068 | 3,622 |
| Total | 2,798 | 1,384 | 0,855 | 10,690 | ||||
| Per Month | ||||||||
| S3 (TIB per One satellite per month) | OLCI | SLSTR | SYNERGY | SRAL | ||||
| NRT | NTC | NRT | NTC | NRT | NTC | NRT | NTC | |
| L0 | 0,000 | 0,000 | 0,000 | 0,000 | 0,000 | 0,000 | 0,000 | 0,000 |
| L1 | 5,421 | 5,433 | 5,229 | 0,000 | 0,000 | 0,000 | 3,842 | 1,969 |
| L2 | 0,655 | 0,659 | 0,791 | 0,000 | 1,638 | 2,081 | 0,166 | 0,074 |
| Total | 6,076 | 6,091 | 6,019 | 0,000 | 1,638 | 2,081 | 4,007 | 2,042 |
| Total | 12,168 | 6,019 | 3,718 | 6,050 | ||||
| Per Year | ||||||||
| S3 (TIB per One satellite per year) | OLCI | SLSTR | SYNERGY | SRAL | ||||
| NRT | NTC | NRT | NTC | NRT | NTC | NRT | NTC | |
| L0 | 0,000 | 0,000 | 0,000 | 0,000 | 0,000 | 0,000 | 0,000 | 0,000 |
| L1 | 65,055 | 65,192 | 62,743 | 0,000 | 0,000 | 0,000 | 46,102 | 23,622 |
| L2 | 7,862 | 7,905 | 9,489 | 0,000 | 19,651 | 24,966 | 1,986 | 0,886 |
| Total | 72,917 | 73,097 | 72,233 | 0,000 | 19,651 | 24,966 | 48,089 | 24,508 |
| Total | 146,014 | 72,233 | 44,618 | 72,597 | ||||
Table 19: Sentinel-3 published data volumes per instrument and level (TiB)
According to the current assumption on the launch dates and the lifetime (RD-EOF-LTS), the following profile is expected for the yearly published data volume (PiB) for each mission:
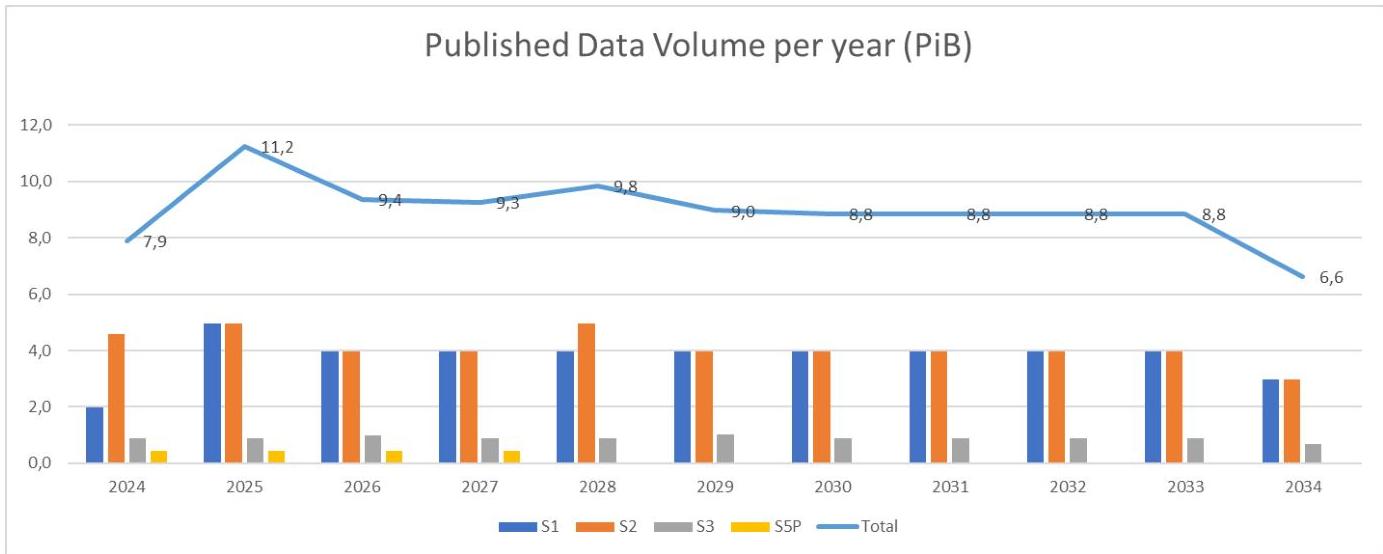
Figure 11 Yearly average published data volume (PiB)
7.2. Published number of products
The assumption for the representations of the overall number of published products yearly per year is that the number of users and the average data volume per year is maintained. The table below reports the number of products published at the Data Access system, for one satellite, divided per product level and mission:
| Number of published products | |||
|---|---|---|---|
| L0 | |||
| One Satellite | Num per day | Num per Month | Num per Year |
| S1 | 1063,70 | 32376,25 | 388515,02 |
| S2 | 0 | 0 | 0 |
| S3 | 0 | 0 | 0 |
| S5P | 0 | 0 | 0 |
| Total | 1.064 | 32.376 | 388.515 |
| L1 | |||
| One Satellite | Num per day | Num per Month | Num per Year |
| S1 | 2417,53 | 73583,48 | 883001,78 |
| S2 (L1C) | 5.877 | 178.759 | 2.145.105 |
| S3 | 1.601 | 48.682 | 584.183 |
| S5P | 1.882 | 56.445 | 677.340 |
| Total | 11.777 | 357.469 | 4.289.629 |
| L2 | |||
| One Satellite | Num per day | Num per Month | Num per Year |
| S1 | 715,32 | 21772,67 | 261272,06 |
| S2 (L2A) | 5.382 | 163.703 | 1.964.430 |
| S3 | 2.772 | 84.324 | 1.011.893 |
| S5P | 1.995 | 59.850 | 718.200 |
| Total | 10.865 | 329.650 | 3.955.795 |
| Total | |||
| One Satellite | Num per day | Num per Month | Num per Year |
| S1 | 4196,55 | 127732,41 | 1532788,86 |
| S2 | 11.259 | 342.461 | 4.109.535 |
| S3 | 4.373 | 133.006 | 1.596.076 |
| S5P | 3.877 | 116.295 | 1.395.540 |
| Total | 23.705 | 719.495 | 8.633.940 |
Table 20 Average yearly number of published products per product level and mission (TiB)
The following tables report instead, separately for Sentinel-1, Sentinel-2 and Sentinel-3, the number of products published at the Data Access system, for one satellite, divided per product type:
| Number of Published Products | ||||||||
| Per Day | ||||||||
| S1 (TiB per One satellite per day) | L0 | GRD | SLC | OCN | ||||
| NRT | NTC | NRT | NTC | NRT | NTC | NRT | NTC | |
| 283 | 781 | 332 | 839 | 300 | 832 | 236 | 432 | |
| Total | 1064 | 1172 | 1132 | 668 | ||||
| Per Week | ||||||||
| S1 (TiB per One satellite week) | L0 | GRD | SLC | OCN | ||||
| NRT | NTC | NRT | NTC | NRT | NTC | NRT | NTC | |
| 1980 | 5466 | 2326 | 5876 | 2101 | 5822 | 1650 | 3025 | |
| Total | 7446 | 8203 | 7923 | 4675 | ||||
| Per Month | ||||||||
| S1 (TiB per One satellite month) | L0 | GRD | SLC | OCN | ||||
| NRT | NTC | NRT | NTC | NRT | NTC | NRT | NTC | |
| 8609 | 23767 | 10115 | 25552 | 9136 | 25314 | 7175 | 13155 | |
| Total | 32376 | 35667 | 34449 | 20330 | ||||
| Per Year | ||||||||
| S1 (TiB per One satellite year) | L0 | GRD | SLC | OCN | ||||
| NRT | NTC | NRT | NTC | NRT | NTC | NRT | NTC | |
| 103305 | 285210 | 121380 | 306620 | 109626 | 303764 | 86097 | 157861 | |
| Total | 388515 | 428000 | 413390 | 243958 | ||||
Table 21 Sentinel-1 number of published products per product type (TiB)
| Number of Published Products | |||||
| Per Day | |||||
| S2 (TiB per One satellite per day) | L0 | L1A | L1B | L1C | L2A |
| 0 | 0 | 0 | 5877 | 5382 | |
| Per Week | |||||
| S2 (TiB per One satellite week) | L0 | L1A | L1B | L1C | L2A |
| 0 | 0 | 0 | 41139 | 37674 | |
| Per Month | |||||
| S2 (TiB per One satellite month) | L0 | L1A | L1B | L1C | L2A |
| 0 | 0 | 0 | 178759 | 163703 | |
| Per Year | |||||
| S2 (TiB per One satellite year) | L0 | L1A | L1B | L1C | L2A |
| 0 | 0 | 0 | 2145105 | 1964430 | |
Table 22 Sentinel-2 number of published products per product type (TiB)
| Number of Published Products | ||||||||
| Per Day | ||||||||
| S3 (TIB per One satellite per day) | OLCI | SLSTR | SYNERGY | SRAL | ||||
| NRT | NTC | NRT | NTC | NRT | NTC | NRT | NTC | |
| L0 | 0 | 0 | 0 | 0 | 0 | 0 | 0 | 0 |
| L1 | 229 | 229 | 472 | 472 | 0 | 0 | 171 | 29 |
| L2 | 229 | 229 | 472 | 943 | 229 | 243 | 343 | 86 |
| Total | 457 | 457 | 943 | 1415 | 229 | 243 | 514 | 114 |
| Total | 915 | 2358 | 472 | 629 | ||||
| Per Week | ||||||||
| S3 (TIB per One satellite per week) | OLCI | SLSTR | SYNERGY | SRAL | ||||
| NRT | NTC | NRT | NTC | NRT | NTC | NRT | NTC | |
| L0 | 0 | 0 | 0 | 0 | 0 | 0 | 0 | 0 |
| L1 | 1601 | 1601 | 3301 | 3301 | 0 | 0 | 1200 | 200 |
| L2 | 1601 | 1601 | 3301 | 6602 | 1601 | 1701 | 8403 | 1400 |
| Total | 3201 | 3201 | 6602 | 9903 | 1601 | 1701 | 9603 | 1600 |
| Total | 6402 | 16505 | 3301 | 11203 | ||||
| Per Month | ||||||||
| S3 (TIB per One satellite per | OLCI | SLSTR | SYNERGY | SRAL | ||||
| NRT | NTC | NRT | NTC | NRT | NTC | NRT | NTC | |
| L0 | 0 | 0 | 0 | 0 | 0 | 0 | 0 | 0 |
| L1 | 6960 | 6960 | 14353 | 14353 | 0 | 0 | 5219 | 870 |
| L2 | 6960 | 6960 | 14353 | 28707 | 6960 | 7395 | 10439 | 2610 |
| Total | 13919 | 13919 | 28707 | 43060 | 6960 | 7395 | 15658 | 3480 |
| Total | 27838 | 71767 | 14354 | 19138 | ||||
| Per Year | ||||||||
| S3 (TIB per One satellite per year) | OLCI | SLSTR | SYNERGY | SRAL | ||||
| NRT | NTC | NRT | NTC | NRT | NTC | NRT | NTC | |
| L0 | 0 | 0 | 0 | 0 | 0 | 0 | 0 | 0 |
| L1 | 83514 | 83514 | 172241 | 172241 | 0 | 0 | 62633 | 10439 |
| L2 | 83514 | 83514 | 172241 | 344482 | 83514 | 88737 | 125266 | 31317 |
| Total | 167029 | 167029 | 344482 | 516723 | 83514 | 88737 | 187899 | 41755 |
| Total | 334058 | 861205 | 172252 | 229655 | ||||
Table 23 Sentinel-3 number of published products per instrument and level (TiB)
According to the current assumption on launch dates and lifetime (RD-EOF-LTS of March 2024), the following profile is expected for the yearly number of products published for each mission:
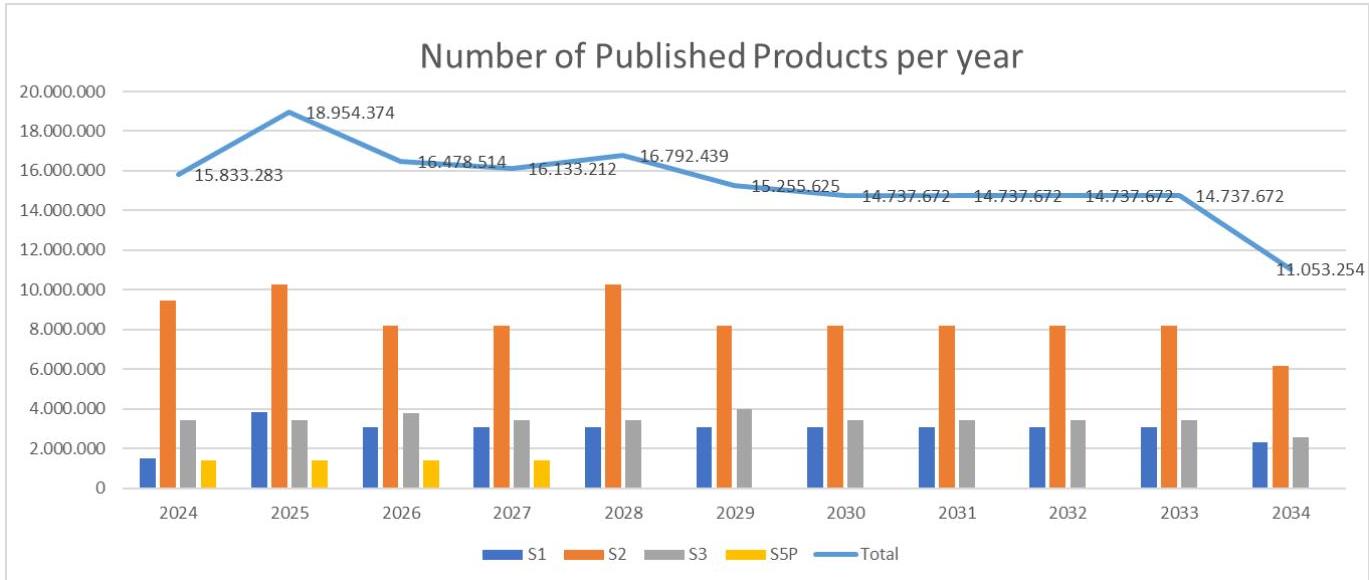
Figure 12 Yearly number of published products
7.3. Downloaded Data volume
According to what reported by the Copernicus Open Access Hub the ‘Archive Exploitation Ratio’ (AER) for 2023 and for each mission are:
| Mission | AER |
|---|---|
| S1 | 1:15 |
| S2 | 1:13 |
| S3 | 1:13 |
| S5P | 1:26 |
Table 24 Archive Exploitation Ratio per mission at the end of 2023
Then, based on downloaded data volume provided by the Copernicus Data Space Ecosystem until December 2024 the average yearly downloaded data volume for each mission has been estimated.
The assumption for the representations of the overall downloaded data volume yearly is that the number of users and the average data volume per year is maintained.
Downloaded Volumes
| One Satellite | TiB per Day | TiB per Month | TiB per Year |
|---|---|---|---|
| S1 | 108,76 | 3.262,78 | 39.724,33 |
| S2 | 138,34 | 4.150,25 | 50.529,35 |
| S3 | 18,49 | 554,67 | 6.753,14 |
| S5P | 12,62 | 378,48 | 4.608,02 |
| Total | 278,21 | 8.346,19 | 101.614,84 |
Table 25 Average yearly downloaded data volume
According to the current assumption on launch dates and lifetime, the following profile is expected for the yearly downloaded data volume (PiB) for each mission:
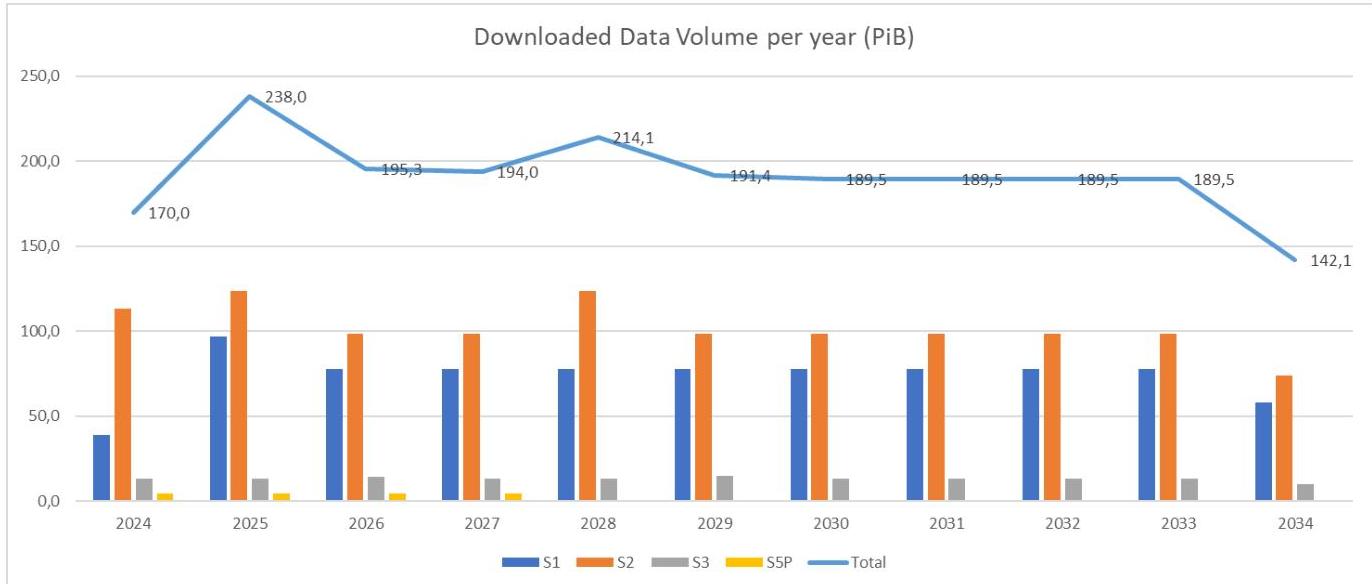
Figure 13 Yearly average downloaded data volume (PiB)
7.4. Downloaded number of products
Based on downloaded number of products provided by the Copernicus Data Space Ecosystem from November 2023 until September 2024 the average yearly downloaded number of products for each mission has been estimated.
The assumption for the representations of the overall downloaded number of products yearly is that the number of users and the average data volume per year is maintained.
Downloaded number of products
| One Satellite | Num per day | Num per Month | Num per Year |
|---|---|---|---|
| S1 | 1.185.960 | 35.578.803 | 433.171.927 |
| S2 | 12.430.291 | 372.908.735 | 4.540.163.849 |
| S3 | 1.365.700 | 40.970.994 | 498.821.852 |
| S5P | 310.018 | 9.300.554 | 113.234.245 |
| Total | 1.185.960 | 458.759.086 | 5.585.391.872 |
Table 26 Average yearly number of products downloaded
According to the current assumption on launch dates and lifetime, the following profile is expected for the yearly number of products downloaded for each mission:
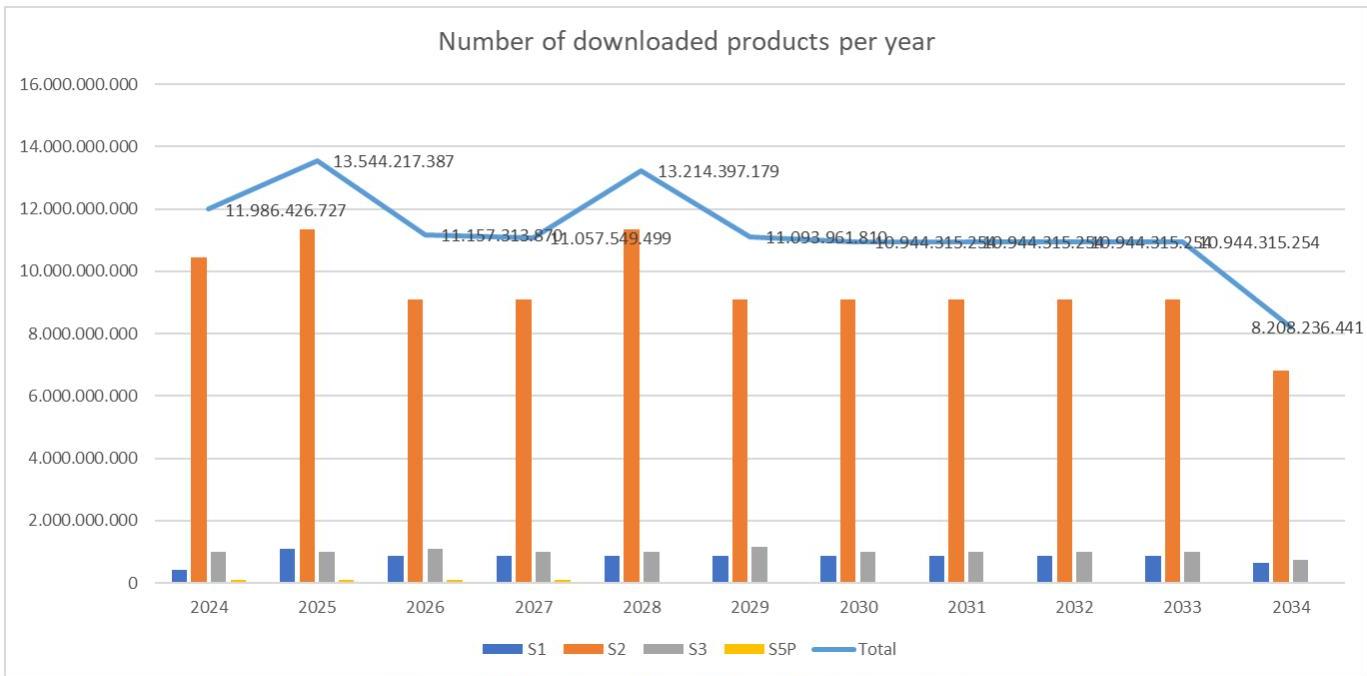
Figure 14 Yearly number of downloaded products
7.5. User scenario
Since the lunch of Sentinel-1A, the Copernicus Sentinels Data Access was provided by the Copernicus Open Access Hub (Open Access Hub (copernicus.eu)), operated until 01/11/2023. This has subsequently been superceeded by the Copernicus Data Space Ecosystem (CDSE).
In both cases the Sentinels Data Access is open worldwide to anyone who wishes to register an account.
During the nine years of operations from 2014 until the closing of the registration in 31 October 2023 the total number of registered users for the Copernicus Open Access Hub reached 759.494. A detailed analysis of the user access scenarios are available here:
https://sentinels.copernicus.eu/web/sentinel/-/ninth-copernicus-sentinel-data-access-annual-report
The Copernicus Data Space Ecosystem (CDSE) has been developed with a strategy to evolve towards an open data space ecosystem that further increases the ease with which users can exploit Copernicus Sentinel data, also without download, thanks to enhanced data access, applications and services.
The number of registered users on the CDSE since the start of its operations until end of 2024 is 309.103. The first data access report for the CDSE is available here:
8. REPROCESSING
8.1. General assumptions
Reprocessing campaigns are performed to take into account processing evolution (e.g. quality improvement) and to provide full consistent dataset since the beginning of the related mission.
Reprocessing activities do not impact operational data production as they are either done by external provider and/or using processing facilities different from the operational ones.
Input data, L0 products and auxiliary data, are retrieved from LTA, while reprocessed output products are disseminated to the data access system in order to be available for the final users. As L0 are the inputs of production and are not part of the reprocessing activities, LTA archives are not impacted, while, concerning the data access system, after the completion of the ingestion of the entire reprocessed data set, old data overlapping in sensing are deleted from it.
8.2. Reprocessing campaigns
The table below reports the main completed data reprocessing campaigns for each mission.
Publication date indicates the date of the availability of the full reprocessed dataset on Data Access system.
For Sentinel-3, reprocessing always refers to NTC products.
| Mission | Product Type | Product Level | Reprocessed Sensing time | Reprocessed Data Volume [GB] | Publication date | PB |
|---|---|---|---|---|---|---|
| S2A/B | MSI_L1B_GR MSI_L1B_DS MSI_L1C_TL MSI_L1C_TC MSI_L1C_DS | L1 | S2A:07/2015 – 31/12/2021 S2B: 03/2017 – 31/12/2021 | 13.678.452 | Sep-24 | 5.0 |
| MSI_L2A_DS MSI_L2A_TL | L2 | S2A:07/2015 – 31/12/2021 S2B: 03/2017 – 31/12/2021 | 12.735.489 | |||
| S3A | OL_1_ERR OL_1_EFR | L1 | 25/04/2016 – 29/11/2017 | 82.600 | Sep-18 | 2.23 |
| OL_2_LRR OL_2_LFR | L2 | 01/03/2016 – 01/02/2018 | 81.000 | |||
| SR_1_SRA___ SR_1_SRA_A_ SR_1_SRA_BS | L1 | 01/03/2016 – 15/02/2018 | 238.000 | Nov-18 | 2.33 | |
| SR_2_LAN___ | L2 | 01/03/2016 – 15/02/2018 | ||||
| S3B | OL_1_ERR OL_1_EFR | L1 | 14/05/2018 - 30/10/2019 | 786.902.880 | Jul-20 | 1.34 |
| OL_2_LRR OL_2_LFR | L2 | 14/05/2018 - 30/10/2019 | 132.347.115 | |||
| SL_1_RBT | L1 | 09/05/2018-16/02/2020 | 12.095.727 | Jan-21 | 1.40 | |
| SL_2_LST | L2 | 09/05/2018-16/02/2020 | 17.539.409 | |||
| S3A/B | SR_2_LAN_SI SR_2_LAN_HY SR_2_LAN_LI | L2 | 01/03/2016 – 01/04/2023 08/05/2018 – 01/04/2023 | 10.500 | Nov-23 | 3.20 |
| S5P | L2__CO___ L2_O3___ L2_CLOUD_ L2__AER_AI | L2 | 30/04/2018 – 31/03/2022 | 38.190 | Dec-22 | 2.4 |
| L1B products | L1 | 30/04/2018 – 25/07/2022 | 1.491.860 | Mar-23 | 2.4 | |
| L2_CH4__ L2_NO2__ L2__AER_LH | L2 | 30/04/2018 – 25/07/2022 | ||||
| L2__CO___ L2_O3___ L2_CLOUD_ L2__AER_AI | L2 | 01/04/2022 - 25/07/2022 | ||||
| L2__SO2___ L2__HCHO___ | L2 | 07/05/2018 – 03/08/2022 | 72.620 | Apr-23 | 2.4 | |
| L2__O3_TCL L2__O3_PR | L2 | 30/04/2018 - 03/08/2022 |
Table 27 Completed reprocessing campaigns
9. DATA FLOW PROCESS CHART
9.1. Sentinel 1 Data flow
Based on the values presented in the previous chapters, an overall view of the data flow of Sentinel-1 is presented here:
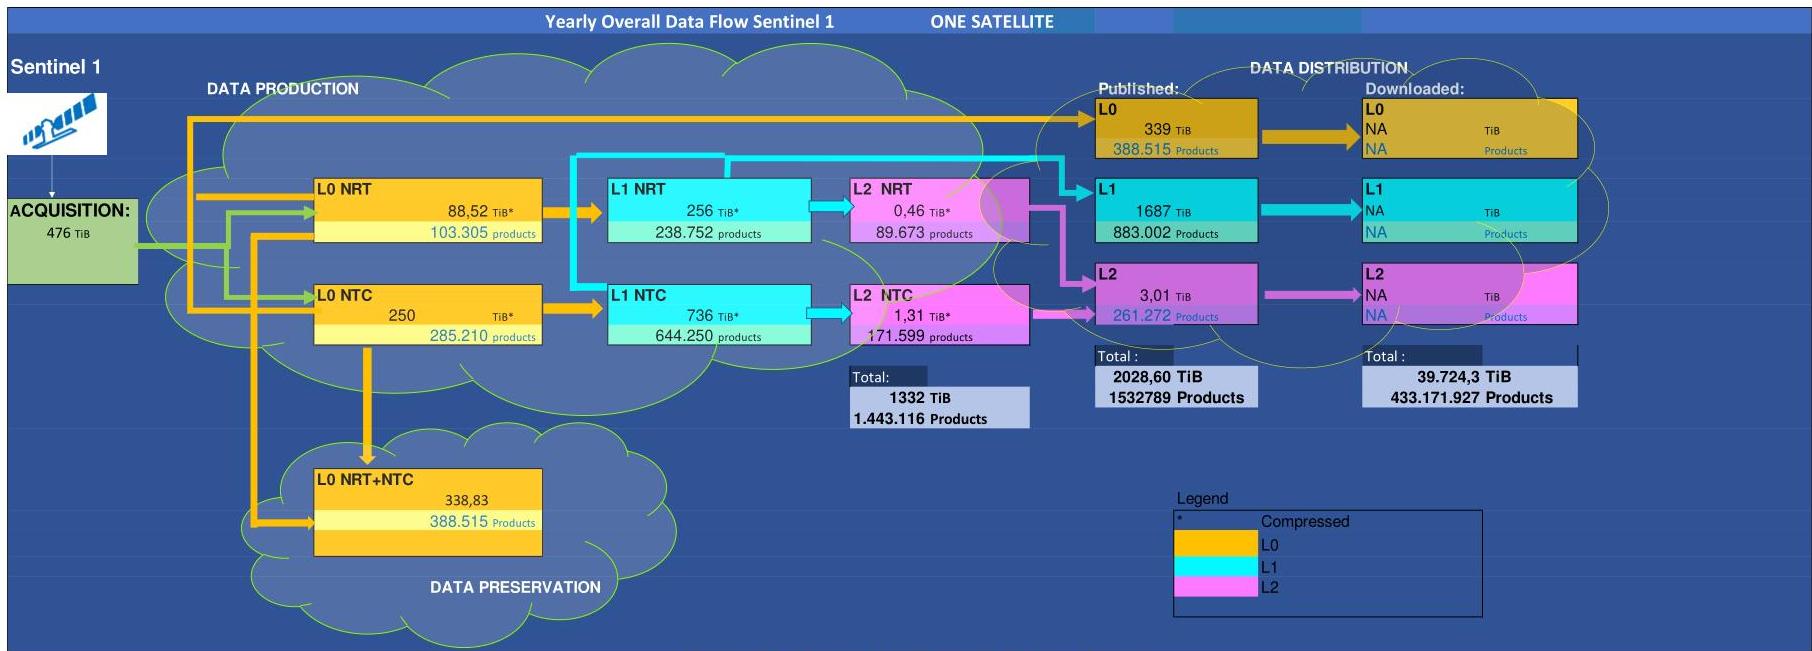
Figure 15 Sentinel 1 Overall Data Flow
9.1.1. Sentinel-1 Particularities
The Sentinel-1 production operation concept is strongly driven by the satellites capabilities and constraints. It shall be noticed that additional data types generated as part of the S1 production (such as the segments for L0) and not intended for preservation or dissemination are outside the scope of this System Technical Budget.
9.1.2. Sentinel-1 On board Data Compression
The Sentinel-1 on-board data compression is based on the Flexible Dynamic Block Adaptive Quantisation (FDBAQ), which provides a variable bit rate coding, resulting in a non deterministic SAR instrument data compression rate [RD-5]. The number of bits allocated to compress the instrument data before memory storage (or before direct downlink in the case of pass-through mode operations) is variable, depending on the surface reflectivity and increasing for bright scatterers.
The allocated number of bits on board varies between 3 and 5, with non-integer intermediate steps. It is defined to reduce the average data rate, ensuring a IW data rate close to the downlink data rate of 260 Mbps.
The direct result of this approach is that the on board memory volume occupied by a given data take will depend on the allocated number of bits during the on board compression process. This number of bits (or resulting data volume) is not fixed for a given area, but is expected to vary for different polarisation and incidence angles and eventually, over time, according to the surface reflectivity changes.
This approach leads to a not fully predictable on-board compression rate and therefore, to a not fully predictable on board memory volume occupied for each data take and to a not fully predictable time required for downlinking each data take. This results in the impossibility to manage data downlink through sensing start and stop times.
Prediction of the occupied memory volume by each acquisition segment (and the required downlink time) and real-time ground monitoring of the memory evolution can be performed using the predicted average downlink rate and complemented by modelling the FDBAQ compression on ground using an accurate global backscattering map.
9.1.3. Sentinel-1 Data Rates
The Sentinel-1 satellite is able to transmit SAR data on ground over two X-band channels at a net rate of 260 Mbps (ISP level) per channel
Estimated average SAR data rates after on-board FDBAQ compression are shown in Figure 16. The SAR instrument data rate may be higher than the data downlink rate (only for Stripmap Swath-1 according to the table below). In such case, data acquired in pass-through mode over
an X-Band Receiving Ground Station might not be completely down-linked over the same ground station if passthrough operations are maintained until the end of the contact time.
| SAR Instrument Mode | Data rate per mode [Mbps] | |
| Single polarization | Dual polarization | |
| Stripmap 1 | 279.132 | 558.264 |
| Stripmap 2 | 232.501 | 465.002 |
| Stripmap 3 | 235.507 | 471.014 |
| Stripmap 4 | 194.839 | 289.678 |
| Stripmap 5-N | 207.477 | 414.954 |
| Stripmap 5-S | 206.142 | 412.284 |
| Stripmap 6 | 183.835 | 367.670 |
| Extra Wide | 63.573 | 127.146 |
| Interferometric Wide | 206.629 | 413.258 |
| Wave | 15.281 | Not Applicable |
Figure 16 Sentinel-1 SAR FDBAQ Estimated Average Data Rates
9.1.4. Compression
The produced data L1 and L2 are compressed for achieving and publishing. The compression rate is 40% less volume archived and published.
9.1.5. L0 Slices
In production, the L0 Assembly/Slicing Processor assembles partial segments of Level 0 Data Takes acquired by different Acquisition to generate a Complete Level 0 Product. The assembled Level 0 Product is also cut into Level 0 Slices used to feed the higher level productions.
The volumes and the number of products presented here are considering only the number of slices for L0 NRT+NTC (300TiB/year).
The volume of L0 NRT data includes only the L0 slices, without considering the segments.
9.2. Sentinel-2 Data flow
Based on the values presented in the previous chapters an overall view of the data flow of Sentinel-2 is presented here:
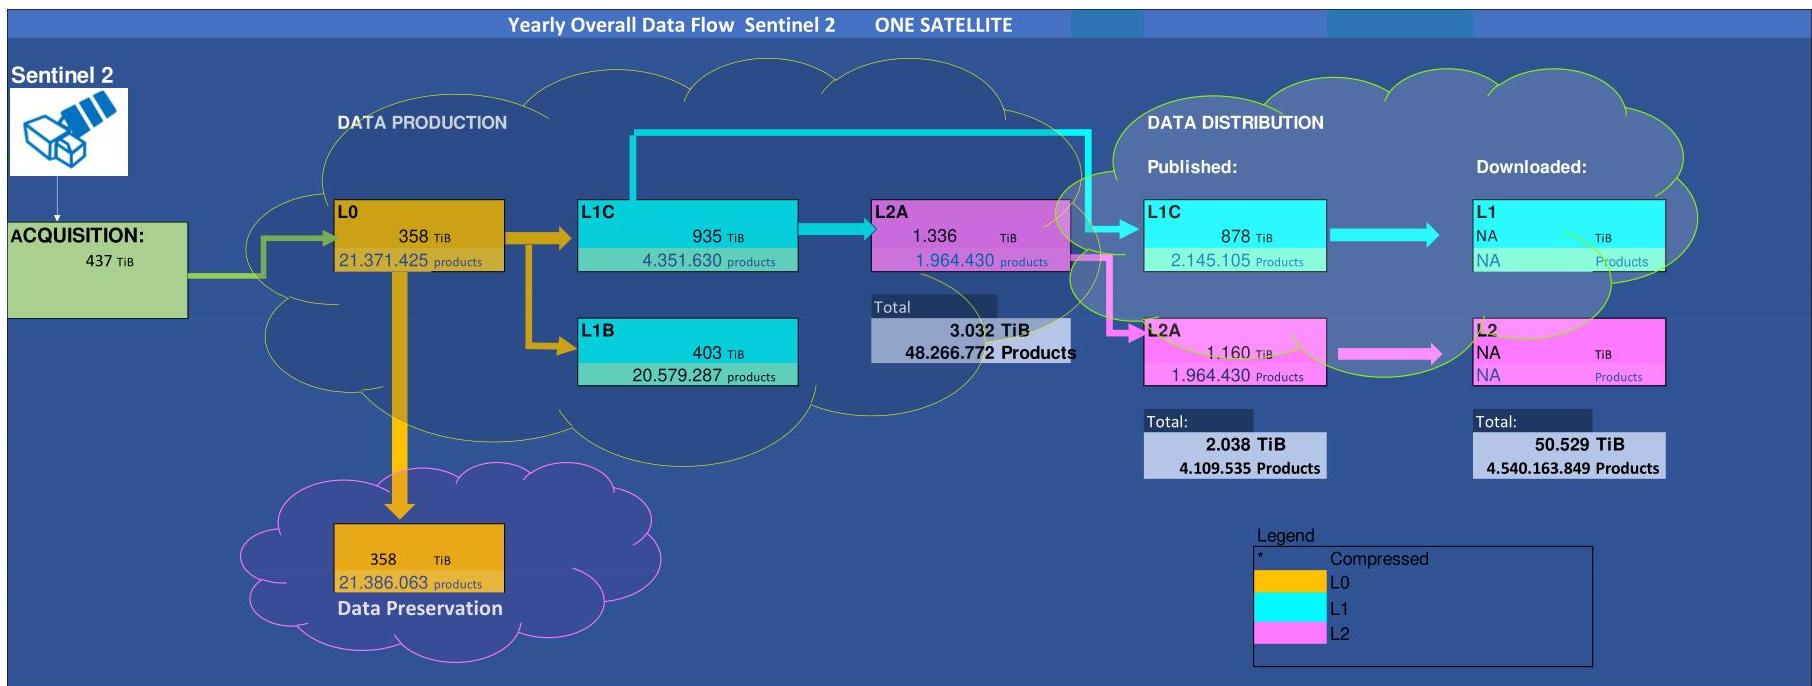
Figure 17 Sentinel 2 Overall Data flow
9.3. Sentinel-2 Number of packages
In the past all granules and the Data strips were archived in a single package. Currently the granules are archived individually. All existing packages in LTA are modified according the new need. This would not impact the overall data volume.
9.4. Sentinel-2 acquisition changes during one year
Sentinel-2 acquisition principle is to acquire data from the land surfaces under specific sun illumination conditions (during the descending portion of the orbit). Hence, the data volume is object of seasonal variations along the year of about 20%.
9.5. Sentinel-2A and Sentinel-2B acquisition differences
Differences in acquisition between Sentinel-2A and Sentinel-2B are not constant over the years but depend on the campaigns of acquisition Mission Planning has to implement.
9.5.1. Levels volume/number of products calculations using proportions relationship
The relation between the levels (L0, L1, L2) volumes or numbers of products can be estimated.
Number of products
The L1B is similar to L0.
The L2A is similar to L1C.
Volumes
The L1C is 2,1 times more than L1B. The level L2A is 30% more than L1C.
9.6. Sentinel-3 Data flow
Based on the values presented in the previous chapters an overall view of the data flow of Sentinel-3 is presented here:
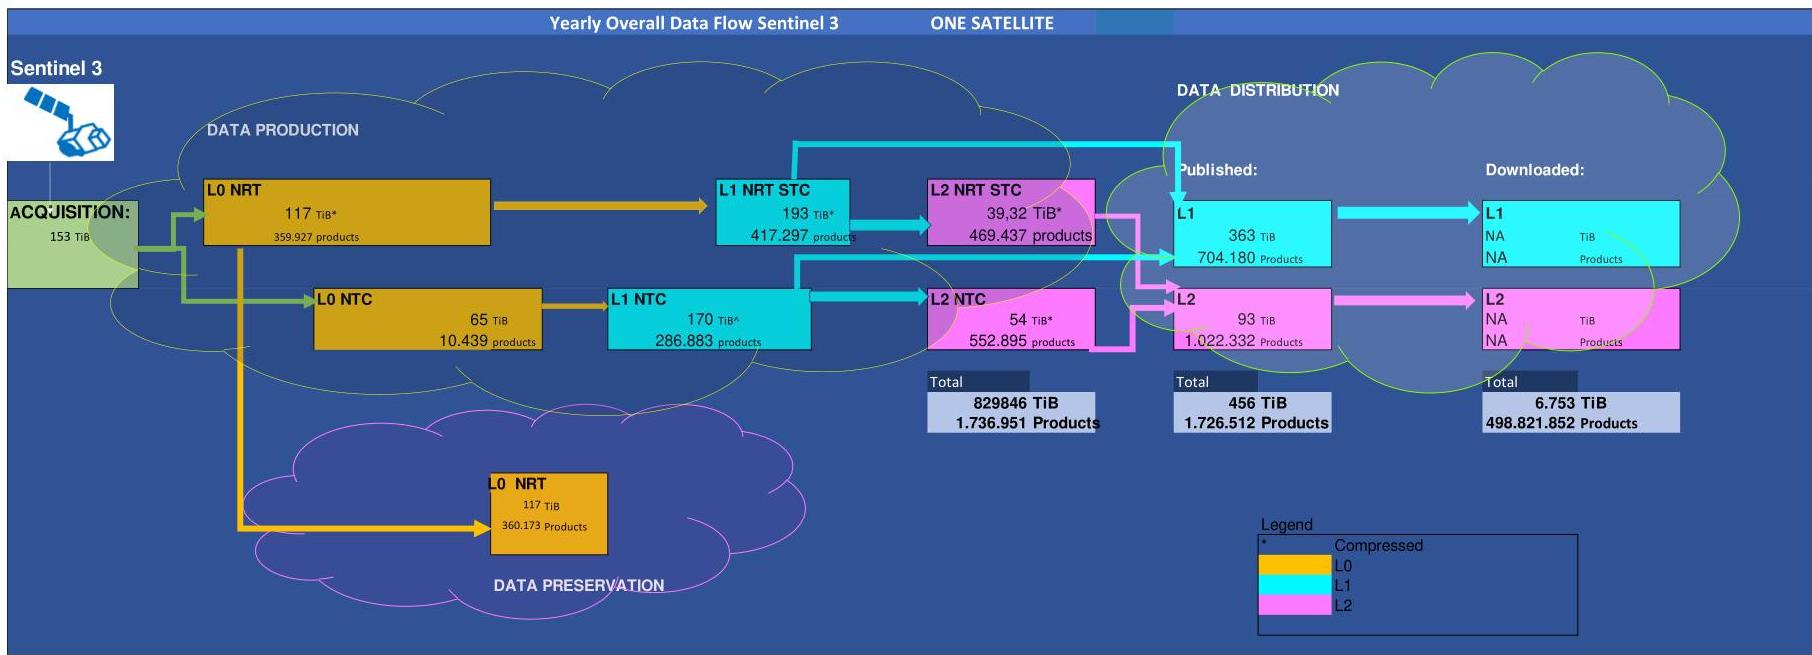
Figure 18 Sentinel 3 Overall Data flow
9.7. Sentinel-3 Particularities
The Sentinel-3 CSC operation concept is strongly driven by the instruments on board, more precisely the OLCI (Ocean and Land Colour Instrument), SLSTR (Sea and Land Surface Temperature Radiometer) and the SRAL (Sentinel-3 Ku/C Radar Altimeter).
The volumes and the numbers of products by product are represented in chapter 10 ANNEX.
9.8. Sentinel-5P Data flow
Based on the values presented in the previous chapters an overall view of the data flow of Sentinel-5P is presented here:
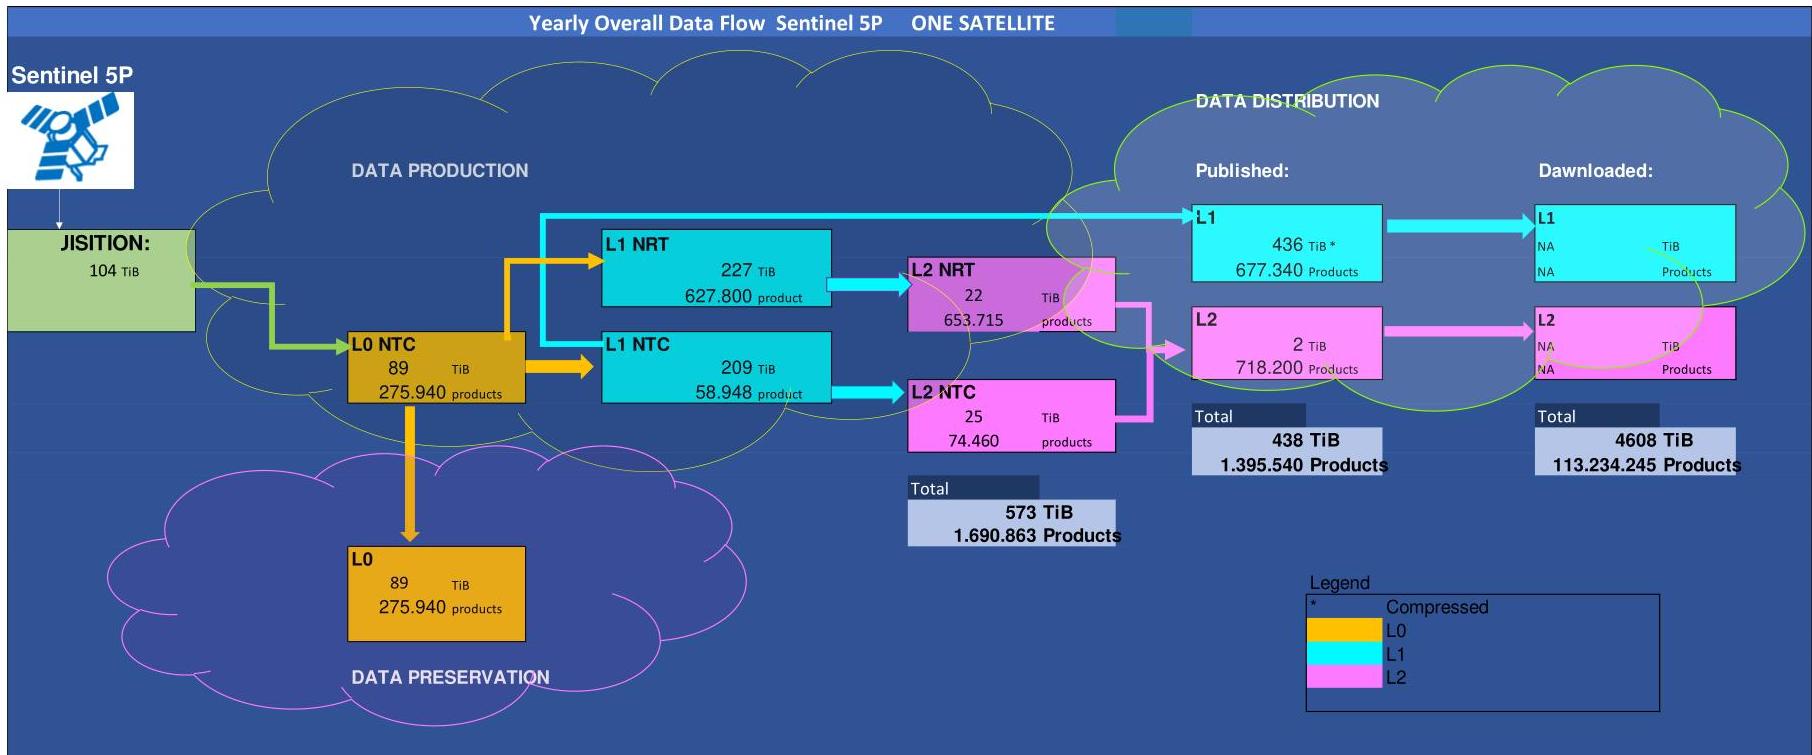
Figure 19 Sentinel-5P Overall Data flow
9.8.1. Sentinel – S5P Particularities
The L1CAL and L1 ENG in NTC are not published via CDSE. They are in any case considered as negligible in overall dataflow.
There is one L0 flow that feeds both NRT and NTC processing chains.
The L1 NTC is compressed: the published data volume is 60 % of the produced data volume.
For Sentinel-5P not only L0 is archived, but also exceptionally there is one copy of L1, L2.
9.8.2. Auxiliary Data
The auxiliary data volume of Sentinel-5P represents 3% of the archived data volume.
10. ANNEX
10.1. Mission Rules
The following tables refers to the estimations for 1 satellite.
The columns ‘P’, ‘A’, ‘D’ indicate the service where the specific Product Type is ‘Produced’, ‘Archived’ and ‘Disseminated’, respectively.
10.2. Sentinel -1
| TYPE | Instrument | Level | Timeliness | #Number products / orbit/unit | #Num/ day | P | A | D | Volume per Orbit [GB] | Volume per day [GB] | |
|---|---|---|---|---|---|---|---|---|---|---|---|
| S(1.2.3.4.5.6)_RAW__0S(SH/SV/ DH/DV) | SM | 0 | NTC | 0,156 | 2,280 | PS | LTA | DA | 0,229 | 3,299 | |
| S(1.2.3.4.5.6)_RAW__0C(SH/SV/ DH/DV) | SM | 0 | NTC | 0,145 | 2,120 | PS | LTA | DA | - | ||
| S(1.2.3.4.5.6)_RAW__0N(SH/SV/ DH/DV) | SM | 0 | NTC | 0,145 | 2,120 | PS | LTA | DA | - | - | |
| S(1.2.3.4.5.6)_RAW__0A(SH/SV/ DH/DV) | SM | 0 | NTC | 0,145 | 2,120 | PS | LTA | DA | - | - | |
| RF_RAW | RFC | 0 | NTC | 0,892 | 13,000 | PS | LTA | DA | 0,076 | 1,100 | |
| IW_RAW__0S(SH/SV/DH/DV) | IW | 0 | NRT | 9,570 | 139,53 0 | PS | LTA | DA | 16,798 | 241,892 | |
| IW_RAW__0C(SH/SV/DH/DV) | IW | 0 | NRT | 0,703 | 10,250 | PS | LTA | DA | 0,153 | 2,199 | |
| IW_RAW__0N(SH/SV/DH/DV) | IW | 0 | NRT | 0,702 | 10,240 | PS | LTA | DA | 0,076 | 1,100 | |
| IW_RAW__0A(SH/SV/DH/DV) | IW | 0 | NRT | 0,703 | 10,250 | PS | LTA | DA | 0,000 | 0,000 | |
| EW_RAW__0S(SH/SV/DH/DV) | EW | 0 | NRT | 1,789 | 26,090 | PS | LTA | DA | 2,062 | 29,687 | |
| EW_RAW__0C(SH/SV/DH/DV) | EW | 0 | NRT | 0,496 | 7,230 | PS | LTA | DA | 0,076 | 1,100 | |
| EW_RAW__0N(SH/SV/DH/DV) | EW | 0 | NRT | 0,496 | 7,230 | PS | LTA | DA | 0,000 | 0,000 | |
| EW_RAW__0A(SH/SV/DH/DV) | EW | 0 | NRT | 0,496 | 7,230 | PS | LTA | DA | 0,000 | 0,000 | |
| IW_RAW__0S(SH/SV/DH/DV) | IW | 0 | NTC | 25,988 | 378,90 0 | PS | LTA | DA | 45,049 | 648,711 | |
| IW_RAW__0C(SH/SV/DH/DV) | IW | 0 | NTC | 3,017 | 43,990 | PS | LTA | DA | 0,458 | 6,597 | |
| IW_RAW__0N(SH/SV/DH/DV) | IW | 0 | NTC | 3,017 | 43,990 | PS | LTA | DA | 0,229 | 3,299 | |
| IW_RAW__0A(SH/SV/DH/DV) | IW | 0 | NTC | 3,017 | 43,990 | PS | LTA | DA | 0,076 | 1,100 | |
| EW_RAW__0S(SH/SV/DH/DV) | EW | 0 | NTC | 2,496 | 36,390 | PS | LTA | DA | 2,138 | 30,786 | |
| EW_RAW__0C(SH/SV/DH/DV) | EW | 0 | NTC | 0,924 | 13,470 | PS | LTA | DA | 0,076 | 1,100 | |
| EW_RAW__0N(SH/SV/DH/DV) | EW | 0 | NTC | 0,924 | 13,470 | PS | LTA | DA | 0,000 | 0,000 | |
| EW_RAW__0A(SH/SV/DH/DV) | EW | 0 | NTC | 0,924 | 13,470 | PS | LTA | DA | - | - | |
| WV_RAW__0S(SH/SV) | WV | 0 | NTC | 1,926 | 28,080 | PS | LTA | DA | 5,116 | 73,667 | |
| WV_RAW__0C(SH/SV) | WV | 0 | NTC | 1,914 | 27,900 | PS | LTA | DA | 0,153 | 2,199 | |
| WV_RAW__0N(SH/SV) | WV | 0 | NTC | 1,914 | 27,900 | PS | LTA | DA | - | - | |
| WV_RAW__0A(SH/SV) | WV | 0 | NTC | 1,914 | 27,900 | PS | LTA | DA | 0,000 | 0,000 | |
| GP_RAW__0_ | GPSR | 0 | _ | 1,924 | 28,050 | PS | LTA | 0,000 | 0,000 | ||
| HK_RAW__0_ | HKTM | 0 | _ | 1,924 | 28,050 | PS | LTA | 0,000 | 0,000 | ||
| OBS_SS__ | Orbit and Burst Synchronis ation | _ | 1,000 | 14,580 | PS | LTA | DA | 0,000 | 0,000 | ||
| S(1.2.3.4.5.6)_SLC__1S(SH/SV/D H/DV) | SM | 1 | NTC | 0,157 | 2,290 | PS | DA | 0,458 | 6,597 | ||
| S(1.2.3.4.5.6)_SLC__1A(SH/SV/D H/DV) | SM | 1 | NTC | 0,157 | 2,290 | PS | DA | - | - | ||
| S(1.2.3.4.5.6)_GRDH_1S(SH/SV/ DH/DV) | SM | 1 | NTC | 0,156 | 2,280 | PS | DA | - | - | ||
| S(1.2.3.4.5.6)_GRDH_1A(SH/SV/ DH/DV) | SM | 1 | NTC | 0,156 | 2,280 | PS | DA | - | - | ||
| IW_SLC__1S(SH/SV/DH/DV) | IW | 1 | NRT | 9,607 | 140,07 0 | PS | DA | 43,293 | 623,422 | ||
| IW_SLC__1A(SH/SV/DH/DV) | IW | 1 | NRT | 9,607 | 140,07 0 | PS | DA | 0,076 | 1,100 | ||
| IW_GRDH_1S(SH/SV/DH/DV) | IW | 1 | NRT | 9,608 | 140,08 0 | PS | DA | 9,163 | 131,941 | ||
| IW_GRDH_1A(SH/SV/DH/DV) | IW | 1 | NRT | 9,608 | 140,08 0 | PS | DA | 0,000 | 0,000 | ||
| EW_SLC__1S(SH/SV/DH/DV) | EW | 1 | NRT | 0,543 | 7,910 | PS | DA | 2,672 | 38,483 | ||
| EW_SLC__1A(SH/SV/DH/DV) | EW | 1 | NRT | 0,543 | 7,910 | PS | DA | 0,000 | 0,000 | ||
| EW_GRDM_1S(SH/SV/DH/DV) | EW | 1 | NRT | 1,789 | 26,080 | PS | DA | 0,458 | 6,597 | ||
| EW_GRDM_1A(SH/SV/DH/DV) | EW | 1 | NRT | 1,789 | 26,080 | PS | DA | - | - | ||
| IW_SLC__1S(SH/SV/DH/DV) | IW | 1 | NTC | 26,132 | 381,01 0 | PS | DA | 122,16 8 | 1759,216 | ||
| IW_SLC__1A(SH/SV/DH/DV) | IW | 1 | NTC | 26,132 | 381,01 0 | PS | DA | 0,229 | 3,299 | ||
| IW_GRDH_1S(SH/SV/DH/DV) | IW | 1 | NTC | 26,136 | 381,06 0 | PS | DA | 26,342 | 379,331 | ||
| IW_GRDH_1A(SH/SV/DH/DV) | IW | 1 | NTC | 26,136 | 381,06 0 | PS | DA | 0,076 | 1,100 | ||
| EW_SLC__1S(SH/SV/DH/DV) | EW | 1 | NTC | 0,115 | 1,680 | PS | DA | 0,611 | 8,796 | ||
| EW_SLC__1A(SH/SV/DH/DV) | EW | 1 | NTC | 0,115 | 1,680 | PS | DA | - | - | ||
| EW_GRDM_1S(SH/SV/DH/DV) | EW | 1 | NTC | 2,497 | 36,400 | PS | DA | 0,534 | 7,697 | ||
| EW_GRDM_1A(SH/SV/DH/DV) | EW | 1 | NTC | 2,497 | 36,400 | PS | DA | - | - | ||
| WV_SLC__1S(SH/SV) | WV | 1 | NTC | 1,936 | 28,230 | PS | DA | 10,995 | 158,329 | ||
| WV_SLC__1A(SH/SV) | WV | 1 | NTC | 1,936 | 28,230 | PS | DA | 0,000 | 0,000 | ||
| SM_OCN__2S(SH/SV/DH/DV) | SM | 2 | NTC | 0,128 | 1,870 | PS | DA | - | - | ||
| SM_OCN__2A(SH/SV/DH/DV) | SM | 2 | NTC | 0,128 | 1,870 | PS | DA | - | - | ||
| IW_OCN__2S(SH/SV/DH/DV) | IW | 2 | NRT | 6,383 | 93,060 | PS | DA | 0,076 | 1,100 | ||
| IW_OCN__2A(SH/SV/DH/DV) | IW | 2 | NRT | 6,383 | 93,060 | PS | DA | 0,000 | 0,000 | ||
| EW_OCN__2S(SH/SV/DH/DV) | EW | 2 | NRT | 1,701 | 24,800 | PS | DA | 0,000 | 0,000 | ||
| EW_OCN__2A(SH/SV/DH/DV) | EW | 2 | NRT | 1,701 | 24,800 | PS | DA | - | - | ||
| IW_OCN__2S(SH/SV/DH/DV) | IW | 2 | NTC | 10,365 | 151,12 0 | PS | DA | 0,076 | 1,100 | ||
| IW_OCN__2A(SH/SV/DH/DV) | IW | 2 | NTC | 10,365 | 151,12 0 | PS | DA | 0,000 | 0,000 | ||
| EW_OCN__2S(SH/SV/DH/DV) | EW | 2 | NTC | 2,390 | 34,850 | PS | DA | 0,076 | 1,100 | ||
| EW_OCN__2A(SH/SV/DH/DV) | EW | 2 | NTC | 2,390 | 34,850 | PS | DA | - | - | ||
| WV_OCN__2S(SH/SV/DH/DV) | WV | 2 | NTC | 1,938 | 28,260 | PS | DA | 0,076 | 1,100 | ||
| WV_OCN__2A(SH/SV/DH/DV) | WV | 2 | NTC | 1,938 | 28,260 | PS | DA | 0,000 | 0,000 |
Auxiliary:
| TYPE | Asynchronous/Systematic | Level | #Num/day | P | A | D | Volume per day [GB] | Volume [GB] |
|---|---|---|---|---|---|---|---|---|
| AUX_PREORB | Systematic | AUX | 14 | POD | LTA | DA | 0,0002 | |
| AUX_RESORB | Systematic | AUX | 14 | POD | LTA | DA | 0,0011 | |
| AUX_POEORB | Systematic | AUX | 1 | POD | LTA | DA | 0,0006 | |
| AUX_WND | Systematic | AUX | 180 | ADGS | LTA | DA | 4,6179 | |
| AUX_WAV | Systematic | AUX | 100 | ADGS | LTA | DA | 0,0387 | |
| AUX_ICE | Systematic | AUX | 1 | ADGS | LTA | DA | 0,0011 | |
| AUX_TEC | Systematic | AUX | 0,8 | ADGS | LTA | DA | 0,0003 | |
| AUX_TRO | Systematic | AUX | 4 | ADGS | LTA | DA | 6,4424 | |
| AUX_GNSSRD | Systematic | AUX | POD | - | DA | 0,0299 | ||
| AUX_PROQUA | Systematic | AUX | POD | - | DA | 0,0100 | ||
| S[1..6]_ETA__AX | Systematic | AUX | 2,50 | PS | 0,0365 | |||
| IW_ETA__AX | Systematic | AUX | 557,00 | PS | 47,2446 | |||
| EW_ETA__AX | Systematic | AUX | 13,00 | PS | 3,9943 | |||
| AUX_ML2 | Asynchronous | AUX | MPC | 0,4992 | ||||
| AUX_PP1 | Asynchronous | AUX | MPC | LTA | DA | 0,0003 | ||
| AUX_CAL | Asynchronous | AUX | MPC | LTA | DA | 0,0010 | ||
| AUX_INS | Asynchronous | AUX | MPC | LTA | DA | 0,0010 | ||
| AUX_PP2 | Asynchronous | AUX | MPC | LTA | DA | 0,0010 | ||
| AUX_SCS | Asynchronous | AUX | MPC | LTA | DA | 2,7488 | ||
| AUX_ITC | Asynchronous | AUX | MPC | LTA | DA | 0,0000 | ||
| AUX_SCF | Asynchronous | AUX | MPC | LTA | DA | 0,0000 |
10.3. Sentinel-2
the L1B, L1C and L2A production is systematic.
The L1A is produced in relation to the calibration observations only, and it is not distributed to the final user . The results of L1A are negligible in numbers and volumes, with respect to other product levels. They have hence not been reflected in the document.
| TYPE | Instrument | Level | Timeliness | #Num per products/orbit/unit | #Num/day | P | A | D | Volume per Orbit [GB] | Volume per day [GB] | |
|---|---|---|---|---|---|---|---|---|---|---|---|
| MSI_L0__DS | MSI | 0 | NTC | 5,817 | 83,190 | PS | LTA | DA | 0,175 | 2,5068 | |
| MSI_L0__GR | MSI | 0 | NTC | 4086,690 | 58439,660 | PS | LTA | DA | 75,199 | 1075,3409 | |
| MSI_L1A_DS | MSI | 1 | NTC | 0,015 | 0,211 | PS | DA | 0,000 | 0,0009 | ||
| MSI_L1A_GR | MSI | 1 | NTC | 1,809 | 25,871 | PS | DA | 0,028 | 0,3959 | ||
| MSI_L1B_DS | MSI | 1 | NTC | 5,427 | 77,608 | PS | DA | 0,049 | 0,7014 | ||
| MSI_L1B_GR | MSI | 1 | NTC | 3937,343 | 56304,000 | PS | DA | 84,874 | 1213,6968 | ||
| MSI_L1C_DS | MSI | 1 | NTC | 5,436 | 77,735 | PS | DA | 0,048 | 0,6795 | ||
| MSI_L1C_TL | MSI | 1 | NTC | 414,126 | 5922,000 | PS | DA | 172,909 | 172,909 2472,5991 | ||
| MSI_L1C_TC | MSI | 1 | NTC | 414,164 | 5922,539 | PS | DA | 24,044 | 343,8351 | ||
| MSIL1C.SAFE | MSI | 1 | NTC | 410,979 | 5877,000 | PS | DA | 184,883 | 184,883 2643,8317 | ||
| MSI_L2A_DS | MSI | 2 | NTC | 5,273 | 75,400 | PS | DA | 0,046 | 0,6630 | ||
| MSI_L2A_TL | MSI | 2 | NTC | 409,185 | 5851,350 | PS | DA | 259,603 | 259,603 3712,3233 | ||
| MSI_L2A_TC | MSI | 2 | NTC | 409,185 | 5851,349 | PS | DA | 21,841 | 312,3283 | ||
| MSIL2A.SAFE | MSI | 2 | NTC | 376,364 | 5382,000 | PS | DA | 244,276 | 244,276 3493,1455 | ||
| AUX_SADATA | MSI | AUX | NTC | 4,000 | 268,880 | PS | LTA | DA | 0,101 | 7,2733 | |
| PRD_HKTM | NTC | 29,000 | PS | LTA | 0,036 | 1,1138 |
Auxiliary:
| TYPE | Asynchronous/Systematic | Level | #Num/day | P | A | D | Volume per day [GB] | Volume [GB] |
|---|---|---|---|---|---|---|---|---|
| AUX_CAMSFO | Systematic | AUX | 2 | ADGS | LTA | DA | 1,074 | |
| AUX_ECMWFD | Systematic | AUX | 2 | ADGS | LTA | DA | 0,468 | |
| AUX_UT1UTC | Systematic | AUX | 0,140 | ADGS | LTA | DA | 0,000 | |
| GIP_R2ABCA (*) | Systematic | AUX | 0,075 | ADGS | LTA | DA | 0,0000 | |
| GIP_R2EQOG (*) | Systematic | AUX | 0,978 | ADGS | LTA | DA | 0,0006 | |
| AUX_GNSSRD | Systematic | AUX | 1 | POD | DA | 0,0240 | ||
| AUX_PROQUA | Systematic | AUX | 1 | POD | DA | 0,0159 | ||
| AUX_POEORB AUX_CAMSAN AUX_CAMSRE | Systematic Asynchronous Asynchronous | AUX AUX AUX | 1 | POD ADGS ADGS | LTA LTA | DA DA DA | 1,074 1,074 |
(*) updated once a month
10.4. Sentinel-3
The L1 and L2 STC budgets are added to the corresponding L1 and L2 NRT budgets.
| TYPE | Instrument | Level | Timeliness | #Num/orbit/unit | #Num/day | P | A | D | Volume per Orbit [GB] | Volume per day [GB] | |
|---|---|---|---|---|---|---|---|---|---|---|---|
| DO_0_DOP__G | DORIS | ISP | NRT | 1 | 14,3 | ACQ | 0,001 | 0,015 | |||
| DO_0_NAV__G | DORIS | ISP | NRT | 1 | 14,3 | ACQ | 0,001 | 0,015 | |||
| GN_0_GNS__G | GNSS | ISP | NRT | 1 | 14,3 | ACQ | 0,009 | 0,123 | |||
| MW_0_MWR__G | MWR | ISP | NRT | 1 | 14,3 | ACQ | 0,003 | 0,046 | |||
| OL_0_CR___G | OLCI | ISP | NRT | 1 | 14,3 | ACQ | 0,008 | 0,107 | |||
| OL_0_EFR__G | OLCI | ISP | NRT | 22 | 314,4 | ACQ | 9,884 | 141,138 | |||
| SL_0_SLT__G | SLSTR | ISP | NRT | 20 | 285,8 | ACQ | 5,297 | 75,636 | |||
| SR_0_CAL__G | SRAL | ISP | NRT | 1 | 14,3 | ACQ | 0,008 | 0,107 | |||
| SR_0_SRA__G | SRAL | ISP | NRT | 10 | 142,9 | ACQ | 7,695 | 109,877 | |||
| TM_0_HKM__G | TM | ISP | NRT | 1 | 14,3 | ACQ | 0,008 | 0,107 | |||
| TM_0_HKM2_G | TM | ISP | NRT | 1 | 14,3 | ACQ | 0,001 | 0,015 | |||
| TM_0_NAT__G | TM | ISP | NRT | 2 | 28,6 | ACQ | 0,001 | 0,015 | |||
| DO_0_DOP___ | DORIS | L0 | NRT | 1 | 14,3 | PS | LTA | DA | 0,001 | 0,007 | |
| DO_0_NAV___ | DORIS | L0 | NRT | 1 | 14,3 | PS | LTA | DA | 0,000 | 0,002 | |
| GN_0_GNS___ | GNSS | L0 | NRT | 6 | 85,7 | PS | LTA | DA | 0,004 | 0,055 | |
| MW_0_MWR___ | MWR | L0 | NRT | 1 | 14,3 | PS | LTA | DA | 0,001 | 0,020 | |
| OL_0_CR0___ | OLCI | L0 | NRT | 1 | 14,3 | PS | LTA | DA | 0,003 | 0,036 | |
| OL_0_CR1___ | OLCI | L0 | NRT | 1 | 14,3 | PS | LTA | DA | 2,446 | 34,931 | |
| OL_0_EFR___ | OLCI | L0 | NRT | 22 | 314,4 | PS | LTA | DA | 8,237 | 117,624 | |
| SL_0_SLT___ | SLSTR | L0 | NRT | 20 | 285,8 | PS | LTA | DA | 4,222 | 60,295 | |
| SR_0_CAL___ | SRAL | L0 | NRT | 1 | 14,3 | PS | LTA | DA | 0,005 | 0,065 | |
| SR_0_SRA___ | SRAL | L0 | NRT | 10 | 142,9 | PS | LTA | DA | 9,799 | 139,932 | |
| TM_0_HKM___ | TM | L0 | NRT | 1 | 14,3 | PS | LTA | 0,007 | 0,096 | ||
| TM_0_HKM2__ | TM | L0 | NRT | 1 | 14,3 | PS | LTA | 0,001 | 0,008 | ||
| TM_0_NAT___ | TM | L0 | NRT | 2 | 28,6 | PS | LTA | 0,003 | 0,043 | ||
| MW_1_CAL___ | MWR | L1 | NRT | 1 | 14,3 | PS | LTA | DA | 0,000 | 0,000 | |
| MW_1_MWR___ | MWR | L1 | NRT | 1 | 14,3 | PS | DA | 0,003 | 0,047 | ||
| OL_1_EFR___ | OLCI | L1 | NRT | 15 | 214,4 | PS | DA | 12,756 | 182,153 | ||
| OL_1_ERR___ | OLCI | L1 | NRT | 1 | 14,3 | PS | DA | 0,958 | 13,682 | ||
| OL_1_RAC___ | OLCI | L1 | NRT | 1 | 14,3 | PS | LTA | DA | 0,000 | 0,000 | |
| OL_1_SPC___ | OLCI | L1 | NRT | 1 | 14,3 | PS | LTA | DA | 0,000 | 0,000 | |
| SL_1_RBT___ | SLSTR | L1 | NRT | 34 | 471,6 | PS | DA | 13,227 | 188,876 | ||
| SR_1_CAL___ | SRAL | L1 | NRT | 1 | 14,3 | PS | LTA | DA | 0,000 | 0,000 | |
| SR_1_SRA_A_ | SRAL | L1 | NRT | 10 | 142,9 | PS | DA | 4,863 | 69,391 | ||
| SR_1_LAN_RD | SRAL | L1 | NRT | 10 | 142,9 | PS | DA | 0,080 | 1,140 | ||
| OL_2_LFR___ | OLCI | L2 | NRT | 15 | 214,4 | PS | DA | 1,483 | 21,183 | ||
| OL_2_LRR___ | OLCI | L2 | NRT | 1 | 14,3 | PS | DA | 0,174 | 2,485 | ||
| SL_2_LST___ | SLSTR | L2 | NRT | 34 | 471,6 | PS | DA | 2,000 | 28,566 | ||
| SR_2_LAN_SI | SRAL | L2 | NRT | 6 | 85,7 | PS | DA | 0,073 | 1,044 | ||
| SR_2_LAN_HY | SRAL | L2 | NRT | 6 | 85,7 | PS | DA | 0,085 | 1,218 | ||
| SR_2_LAN_LI | SRAL | L2 | NRT | 6 | 85,7 | PS | DA | 0,071 | 1,009 | ||
| OL_0_EFR___ | OLCI | L0 | NTC | 1 | 14,3 | PS | 9,134 | 130,436 | |||
| SL_0_SLT___ | SLSTR | L0 | NTC | 1 | 14,3 | PS | 4,637 | 66,209 | |||
| MW_1_MWR___ | MWR | L1 | NTC | 1 | 14,3 | PS | DA | 0,003 | 0,046 | ||
| OL_1_EFR___ | OLCI | L1 | NTC | 15 | 214,4 | PS | DA | 12,785 | 182,565 | ||
| SL_1_RBT___ | SLSTR | L1 | NTC | 34 | 471,6 | PS | DA | 13,198 | 188,463 | ||
| SR_1_SRA_A_ | SRAL | L1 | NTC | 2 | 28,6 | PS | DA | 4,634 | 71,110 | ||
| SR_1_LAN_RD | SRAL | L1 | NTC | 2 | 28,6 | PS | DA | 0,081 | 1,150 | ||
| SY_1_MISR__ | SYN | L1 | NTC | 1 | 14,3 | PS | DA | 3,853 | 55,023 | ||
| OL_1_ERR___ | OLCI | L1 | NTC | 1 | 14,3 | PS | DA | 0,958 | 13,682 | ||
| OL_2_LFR___ | OLCI | L2 | NTC | 15 | 214,4 | PS | DA | 1,492 | 21,306 | ||
| OL_2_LRR___ | OLCI | L2 | NTC | 1 | 14,3 | PS | DA | 0,174 | 2,489 | ||
| SL_2_FRP___ | SLSTR | L2 | NTC | 34 | 471,6 | PS | DA | 2,330 | 33,277 | ||
| SL_2_LST___ | SLSTR | L2 | NTC | 34 | 471,6 | PS | DA | 1,924 | 27,479 | ||
| SR_2_LAN_SI | SRAL | L2 | NTC | 2 | 28,6 | PS | DA | 0,063 | 0,907 | ||
| SR_2_LAN_HY | SRAL | L2 | NTC | 2 | 28,6 | PS | DA | 0,080 | 1,137 | ||
| SR_2_LAN_LI | SRAL | L2 | NTC | 2 | 28,6 | PS | DA | 0,044 | 0,622 | ||
| SY_2_AOD___ | SYN | L2 | NTC | 1 | 14,3 | PS | DA | 0,034 | 0,481 | ||
| SY_2_SYN___ | SYN | L2 | NTC | 15 | 214,4 | PS | DA | 5,122 | 73,145 | ||
| SY_2_V10___ | SYN | L2 | NTC | 0 | 0,0 | PS | DA | 0,020 | 0,292 | ||
| SY_2_VG1___ | SYN | L2 | NTC | 0 | 0,0 | PS | DA | 0,058 | 0,830 | ||
| SY_2_VGK___ | SYN | L2 | NTC | 1 | 14,3 | PS | DA | 0,042 | 0,600 | ||
| SY_2_VGP___ | SYN | L2 | NTC | 1 | 14,3 | PS | DA | 0,029 | 0,409 | ||
| SR_0_SRA___ | SRAL | L0 | STC | 1 | 14,3 | PS | 4,615 | 65,896 | |||
| MW_1_MWR___ | MWR | L1 | STC | 1 | 14,3 | PS | DA | 0,003 | 0,047 | ||
| SR_1_SRA_A_ | SRAL | L1 | STC | 2 | 28,6 | PS | DA | 4,522 | 69,391 | ||
| SR_1_LAN_RD | SRAL | L1 | STC | 2 | 28,6 | PS | DA | 0,079 | 1,129 | ||
| SY_1_MISR__ | SYN | L1 | STC | 1 | 14,3 | PS | DA | 3,853 | 55,023 | ||
| SR_2_LAN_SI | SRAL | L2 | STC | 2 | 28,6 | PS | DA | 0,064 | 0,916 | ||
| SR_2_LAN_HY | SRAL | L2 | STC | 2 | 28,6 | PS | DA | 0,079 | 1,133 | ||
| SR_2_LAN_LI | SRAL | L2 | STC | 2 | 28,6 | PS | DA | 0,046 | 0,659 | ||
| SY_2_SYN___ | SYN | L2 | STC | 15 | 214,4 | PS | DA | 4,038 | 57,659 | ||
| SY_2_V10___ | SYN | L2 | STC | 0 | 0,0 | PS | DA | 0,018 | 0,261 | ||
| SY_2_VG1___ | SYN | L2 | STC | 0 | 0,0 | PS | DA | 0,058 | 0,827 | ||
| SY_2_VGK___ | SYN | L2 | STC | 1 | 14,3 | PS | DA | 0,076 | 1,084 | ||
| SY_2_VGP___ | SYN | L2 | STC | 1 | 14,3 | PS | DA | 0,029 | 0,409 | ||
| HK_RAW__ | TM | RAW | NRT | 1 | 14,3 | 0,005 | 0,077 |
Auxiliary:
| TYPE | Asynchronous/Systematic | Level | #Num/day | P | A | D | Volume per day [GB] | Volume [GB] |
|---|---|---|---|---|---|---|---|---|
| AUX_MOEORB | Systematic | AUX | 1 | POD | - | DA | ||
| AUX_POEORB | Systematic | AUX | 1 | POD | - | DA | ||
| AUX_PRCPTF | Systematic | AUX | 1 | POD | - | DA | ||
| AUX_GNSSRD | Systematic | AUX | 2 | POD | LTA | DA | 0,0600 | |
| AUX_PROQUA | Systematic | AUX | 1 | POD | - | DA | 0,0159 | |
| AUX_COMB | Systematic | AUX | 1 | POD | DA | 0,0020 | ||
| SR___POE_AX | Systematic | AUX | 9 | POD | - | DA | ||
| AX___MF1_AX | Systematic | AUX | 8 | ADGS | LTA | DA | 1,3800 | |
| AX___MFA_AX | Systematic | AUX | 4 | ADGS | LTA | DA | 0,0500 | |
| AX___MA1_AX | Systematic | AUX | 4 | ADGS | LTA | DA | 0,6300 | |
| AX___MF2_AX | Systematic | AUX | 8 | ADGS | LTA | DA | 5,4800 | |
| AX___MA2_AX | Systematic | AUX | 4 | ADGS | LTA | DA | 2,7800 | |
| AX___FPO_AX | Systematic | AUX | 1 | ADGS | LTA | DA | 0,0000 | |
| AX___FRO_AX | Systematic | AUX | 1 | ADGS | LTA | DA | 0,0018 | |
| SR_1_CA{1L,1S,2K,2C}AX | Systematic | AUX | 6 | PS | LTA | DA | 0,0678 | |
| MW_1_{NIR,DNB,MON}_AX | Systematic | AUX | 14,28 | PS | LTA | DA | 3,0702 | |
| SL_1_VSC_AX | Systematic | AUX | 14,28 | PS | LTA | DA | 0,0002 | |
| SR___MGNPAX | Systematic | AUX | 1 | ADGS | LTA | DA | 0,0006 | |
| SR___POEPAX | Systematic | AUX | 1 | ADGS | LTA | DA | 0,0006 | |
| SR_2_PMPPAX | Systematic | AUX | 1 | ADGS | LTA | - | 0,0004 | |
| SR_2_PCPPAX | Systematic | AUX | 1 | ADGS | LTA | DA | 0,0004 | |
| SR___MDO_AX | Systematic | 1 | ADGS | LTA | DA | 0,0001 | ||
| SR___POESAX | Systematic | 1 | ADGS | LTA | DA | 0,0001 | ||
| SR_2_PMPSAX | Systematic | 1 | ADGS | LTA | DA | 0,0000 | ||
| SR_2_RMO_AX | Systematic | 4 | ADGS | LTA | DA | 0,0061 | ||
| SR_2_PMO_AX | Systematic | 4 | ADGS | LTA | DA | 0,0061 | ||
| SR_2_POL_AX | Systematic | 1 | ADGS | LTA | DA | 0,0003 | ||
| SR_2_PGI_AX | Systematic | 1 | ADGS | LTA | DA | 0,0002 | ||
| SR_2_RGI_AX | Systematic | 1 | ADGS | LTA | DA | 0,0002 | ||
| SR_1_USO_AX | Systematic | 1 | ADGS | LTA | DA | 0,0007 | ||
| SR___MGNSAX | Systematic | 1 | ADGS | LTA | DA | 0,0001 | ||
| SR_2_SIC{N,S}AX | Systematic | 1 | ADGS | LTA | DA | 0,0021 | ||
| SR_2_SIF{N,S}AX | Systematic | 1 | ADGS | LTA | DA | 0,0021 | ||
| SR_2_ICTNAX | Systematic | 1 | ADGS | LTA | DA | 0,0060 | ||
| SR_2_ICTSAX | Systematic | 1 | ADGS | LTA | DA | 0,0042 | ||
| SL_2_SSTAAX | Systematic | 1 | ADGS | LTA | DA | 0,0160 | ||
| SL_2_DIMSAX | Systematic | 1 | ADGS | LTA | DA | 0,0024 | ||
| AX___OSF_AX | Asynchronous | AUX | ADGS | LTA | DA |
10.4.1. Sentinel 5P
NTC is equivalent to the OFFL.
There is one L0 flow that feeds both NRT and NTC chains.
| TYPE | Instrument | Level | Timeliness | #Num/orbit/unit | #Num/day | P | A | D | Volume per Orbit GB | Volume per day GB | |
|---|---|---|---|---|---|---|---|---|---|---|---|
| OPER_L0__ENG_A_ | TROPOMI | L0 | NTC | 5,5 | 12,7 | LTA | DA | 0,014 | 0,199 | ||
| OPER_L0__ODB_1_ | TROPOMI | L0 | NTC | 5,5 | 12,7 | LTA | DA | 0,955 | 13,561 | ||
| OPER_L0__ODB_2_ | TROPOMI | L0 | NTC | 5,5 | 12,7 | LTA | DA | 2,985 | 42,387 | ||
| OPER_L0__ODB_3_ | TROPOMI | L0 | NTC | 5,5 | 12,7 | LTA | DA | 2,985 | 42,387 | ||
| OPER_L0__ODB_4_ | TROPOMI | L0 | NTC | 5,5 | 12,7 | LTA | DA | 2,985 | 42,387 | ||
| OPER_L0__ODB_5_ | TROPOMI | L0 | NTC | 5,5 | 12,7 | LTA | DA | 2,985 | 42,387 | ||
| OPER_L0__ODB_6_ | TROPOMI | L0 | NTC | 5,5 | 12,7 | LTA | DA | 2,985 | 42,387 | ||
| OPER_L0__ODB_7_ | TROPOMI | L0 | NTC | 5,5 | 12,7 | LTA | DA | 1,657 | 23,529 | ||
| OPER_L0__ODB_8_ | TROPOMI | L0 | NTC | 5,5 | 12,7 | LTA | DA | 1,657 | 23,529 | ||
| OPER_L0__SAT_A_ | TROPOMI | L0 | NTC | 5,5 | 12,7 | LTA | DA | 0,002 | 0,028 | ||
| OFFL_L1B_CA_SIR | TROPOMI | L1B | NTC | 1 | 14,5 | PS | LTA | DA | 3,55 | 50,410 | |
| OFFL_L1B_CA_UVN | TROPOMI | L1B | NTC | 1 | 14,5 | PS | LTA | DA | 16,857 | 239,369 | |
| OFFL_L1B_ENG_DB | TROPOMI | L1B | NTC | 1 | 14,5 | PS | LTA | DA | 0,06 | 0,852 | |
| OFFL_L1B_IR_SIR | TROPOMI | L1B | NTC | 1 | 1 | PS | LTA | DA | 0,004 | 0,057 | |
| OFFL_L1B_IR_UVN | TROPOMI | NTC | 1 | 1 | PS | LTA | DA | 0,012 | 0,170 | ||
| OFFL_L1B_RA_BD1 | TROPOMI | L1B | NTC | 1 | 14,5 | PS | LTA | DA | 0,681 | 9,670 | |
| OFFL_L1B_RA_BD2 | TROPOMI | L1B | NTC | 1 | 14,5 | PS | LTA | DA | 3,571 | 50,708 | |
| OFFL_L1B_RA_BD3 | TROPOMI | L1B | NTC | 1 | 14,5 | PS | LTA | DA | 3,571 | 50,708 | |
| OFFL_L1B_RA_BD4 | TROPOMI | L1B | NTC | 1 | 14,5 | PS | LTA | DA | 3,571 | 50,708 | |
| OFFL_L1B_RA_BD5 | TROPOMI | L1B | NTC | 1 | 14,5 | PS | LTA | DA | 3,571 | 50,708 | |
| OFFL_L1B_RA_BD6 | TROPOMI | L1B | NTC | 1 | 14,5 | PS | LTA | DA | 3,571 | 50,708 | |
| OFFL_L1B_RA_BD7 | TROPOMI | L1B | NTC | 1 | 14,5 | PS | LTA | DA | 2,143 | 30,431 | |
| OFFL_L1B_RA_BD8 | TROPOMI | L1B | NTC | 1 | 14,5 | PS | LTA | DA | 2,143 | 30,431 | |
| OFFL_L2__AER_AI | TROPOMI | L2 | NTC | 1 | 14,5 | PS | LTA | DA | 0,219 | 3,110 | |
| OFFL_L2__AER_LH | TROPOMI | L2 | NTC | 1 | 14,5 | PS | LTA | DA | 0,086 | 1,221 | |
| OFFL_L2__CH4_ | TROPOMI | L2 | NTC | 1 | 14,5 | PS | LTA | DA | 0,061 | 0,866 | |
| OFFL_L2__CLOUD_ | TROPOMI | L2 | NTC | 1 | 14,5 | PS | LTA | DA | 0,512 | 7,270 | |
| OFFL_L2__CO____ | TROPOMI | L2 | NTC | 1 | 14,5 | PS | LTA | DA | 0,209 | 2,968 | |
| OFFL_L2__FRESCO | TROPOMI | L2 | NTC | 1 | 14,5 | PS | LTA | DA | 0,206 | 2,925 | |
| OFFL_L2__HCHO_ | TROPOMI | L2 | NTC | 1 | 14,5 | PS | LTA | DA | 0,757 | 10,749 | |
| OFFL_L2__NO2___ | TROPOMI | L2 | NTC | 1 | 14,5 | PS | LTA | DA | 0,606 | 8,605 | |
| OFFL_L2__NP_BD3 | TROPOMI | L2 | NTC | 1 | 14,5 | PS | LTA | DA | 0,435 | 6,177 | |
| OFFL_L2__NP_BD6 | TROPOMI | L2 | NTC | 1 | 14,5 | PS | LTA | DA | 0,433 | 6,149 | |
| OFFL_L2__NP_BD7 | TROPOMI | L2 | NTC | 1 | 14,5 | PS | LTA | DA | 0,209 | 2,968 | |
| OFFL_L2__03_TCL | TROPOMI | L2 | NTC | 1 | 1 | PS | LTA | DA | 0,001 | 0,014 | |
| OFFL_L2__O3__PR | TROPOMI | L2 | NTC | 1 | 14,5 | PS | LTA | DA | 0,391 | 5,552 | |
| OFFL_L2__O3____ | TROPOMI | L2 | NTC | 1 | 14,5 | PS | LTA | DA | 0,335 | 4,757 | |
| OFFL_L2__SO2___ | TROPOMI | L2 | NTC | 1 | 14,5 | PS | LTA | DA | 1,064 | 15,109 | |
| NRTI_L1B_ENG_DB | TROPOMI | L1B | NRT | 20,5 | 288 | PS | 0,109 | 1,548 | |||
| NRTI_L1B_RA_BD1 | TROPOMI | L1B | NRT | 12 | 179 | PS | 1,36407 | 19,370 | |||
| NRTI_L1B_RA_BD2 | TROPOMI | L1B | NRT | 12 | 179 | PS | 7,87189 | 111,781 | |||
| NRTI_L1B_RA_BD3 | TROPOMI | L1B | NRT | 12 | 179 | PS | 7,87189 | 111,781 | |||
| NRTI_L1B_RA_BD4 | TROPOMI | L1B | NRT | 12 | 179 | PS | 7,87189 | 111,781 | |||
| NRTI_L1B_RA_BD5 | TROPOMI | L1B | NRT | 12 | 179 | PS | 7,87189 | 111,781 | |||
| NRTI_L1B_RA_BD6 | TROPOMI | L1B | NRT | 12 | 179 | PS | 7,87189 | 111,781 | |||
| NRTI_L1B_RA_BD7 | TROPOMI | L1B | NRT | 12 | 179 | PS | 3,66583 | 52,055 | |||
| NRTI_L1B_RA_BD8 | TROPOMI | L1B | NRT | 12 | 179 | PS | 3,66583 | 52,055 | |||
| NRTI_L2__AER_AI | TROPOMI | L2 | NRT | 12 | 179 | PS | DA | 0,23153 | 3,288 | ||
| NRTI_L2__AER_LH | TROPOMI | L2 | NRT | 12 | 179 | PS | DA | 0,08779 | 1,247 | ||
| NRTI_L2__CLOUD_ | TROPOMI | L2 | NRT | 12 | 179 | PS | DA | 0,52093 | 7,397 | ||
| NRTI_L2__CO____ | TROPOMI | L2 | NRT | 12 | 179 | PS | DA | 0,22960 | 3,260 | ||
| NRTI_L2__FRESCO | TROPOMI | L2 | NRT | 12 | 179 | PS | DA | 0,21802 | 3,096 | ||
| NRTI_L2__HCHO_ | TROPOMI | L2 | NRT | 12 | 179 | PS | DA | 0,85858 | 12,192 | ||
| NRTI_L2__NO2___ | TROPOMI | L2 | NRT | 12 | 179 | PS | DA | 0,61268 | 8,700 | ||
| NRTI_L2__03_TCL | TROPOMI | L2 | NRT | 0,07 | 1 | PS | DA | 0,00008 | 0,001 | ||
| NRTI_L2__O3__PR | TROPOMI | L2 | NRT | 12 | 179 | PS | DA | 0,41549 | 5,900 | ||
| NRTI_L2__O3____ | TROPOMI | L2 | NRT | 12 | 179 | PS | DA | 0,37324 | 5,300 | ||
| NRTI_L2__SO2___ | TROPOMI | L2 | NRT | 12 | 179 | PS | DA | 1,14789 | 16,300 |
Auxiliary:
| TYPE | Asynchronous/ Systematic | Level | #Num/day | P | A | D | Volume per day [GB] | Volume [GB] |
|---|---|---|---|---|---|---|---|---|
| AUX_MET_2D | Systematic | AUX | 2 | PS | LTA | DA | 0,100 | |
| AUX_MET_QP | Systematic | AUX | 2 | PS | LTA | DA | 1,423 | |
| AUX_MET_TP | Systematic | AUX | 2 | PS | LTA | DA | 1,236 | |
| AUX_CTMCH4 (*) | Systematic | AUX | 0,003 | MPC | LTA | DA | 0,001 | |
| AUX_CTM_CO (*) | Systematic | AUX | 0,003 | MPC | LTA | DA | 0,000 | |
| AUX_CTMANA | Systematic | AUX | 1 | PS | LTA | DA | 1,527 | |
| AUX_CTMFCT | Systematic | AUX | 1 | PS | LTA | DA | 7,799 | |
| AUX_NISE | Systematic | AUX | 1 | EXT | LTA | DA | 0,002 | |
| AUX_IERS_B (**) | Systematic | AUX | 0,033 | EXT | LTA | 0,000 | ||
| (*)AUX_IERS_C | Systematic | AUX | 0,003 | EXT | LTA | 0,000 | ||
| VIIRS_CM | Systematic | AUX | 149,7 | PS | LTA | 31,875 | ||
| VIIRS_L1B_GEO | Systematic | AUX | 990 | PS | LTA | 24,438 | ||
| VIIRS_L1B_RR | Systematic | AUX | 2970 | PS | LTA | 14,375 | ||
| VIIRS_CP | Systematic | AUX | 149,7 | PS | LTA | 7,906 | ||
| VIIRS_DCOMP | Systematic | AUX | 149,7 | PS | LTA | 23,906 | ||
| VIIRS_CTH | Systematic | AUX | 149,7 | PS | LTA | 58,438 |
(*) updated once a year (**) updated once a month